

338
Land-Ocean Systems in the Siberian Arctic: Dynamics and History
40
methane emission
~
30
~
-b
x
'" E 20
x ""
I
U
Cl
10
oS
0
4
temperature
3
IT
- - -5 cm below surface
- - - - -10 cm below surface
L
I2
" " -
Q)
0
0
0
::J
(/)
E -10
0
.....
- E -20
£
.L:
- - water table
.... Q.
- - - - permafrost boundary
Q) -30
"0
o 10 20 30 40 50 60 70 80 90 100 [hours]
24_August1996
28. August 1996
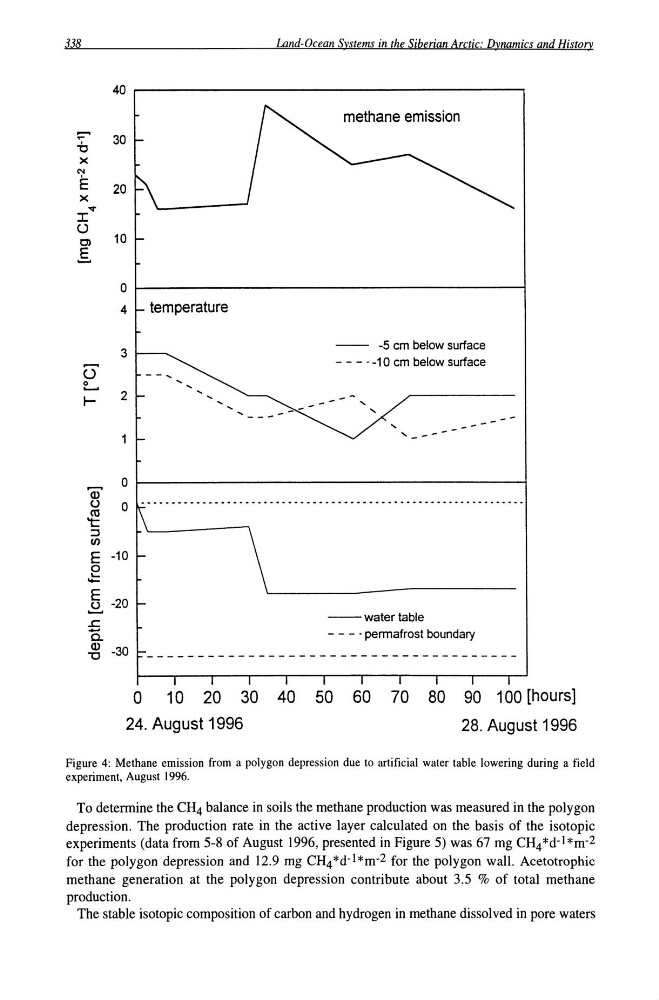
Figure 4: Methane emission from a polygon depression due to artificial water table lowering during a field
experiment, August 1996.
To detennine the CH 4 balance in soils the methane production was measured in the polygon
depression. The production rate in the active layer calculated on the basis of the isotopic
experiments (data from 5-8 of August 1996, presented in Figure 5) was 67 mg CH 4 *d- 1*m-2
for the polygon depression and 12.9 mg CH 4 *d- l *m- 2 for the polygon wall. Acetotrophic
methane generation at the polygon depression contribute about 3.5 % of total methane
production.
The stable isotopic composition of carbon and hydrogen in methane dissolved in pore waters
Land-Ocean Systems in the Siberian Arctic: Dynamics and History
40
methane emission
~
30
~
-b
x
'" E 20
x ""
I
U
Cl
10
oS
0
4
temperature
3
IT
- - -5 cm below surface
- - - - -10 cm below surface
L
I2
" " -
Q)
0
0
0
::J
(/)
E -10
0
.....
- E -20
£
.L:
- - water table
.... Q.
- - - - permafrost boundary
Q) -30
"0
o 10 20 30 40 50 60 70 80 90 100 [hours]
24_August1996
28. August 1996
Figure 4: Methane emission from a polygon depression due to artificial water table lowering during a field
experiment, August 1996.
To detennine the CH 4 balance in soils the methane production was measured in the polygon
depression. The production rate in the active layer calculated on the basis of the isotopic
experiments (data from 5-8 of August 1996, presented in Figure 5) was 67 mg CH 4 *d- 1*m-2
for the polygon depression and 12.9 mg CH 4 *d- l *m- 2 for the polygon wall. Acetotrophic
methane generation at the polygon depression contribute about 3.5 % of total methane
production.
The stable isotopic composition of carbon and hydrogen in methane dissolved in pore waters