

Samarkin et at.: Studies of Methane Production and Emission
335
5
methane emission
~
4
~
-b
><
3
N
E
><
2
v
I
U
Cl
oS 0
12
temperature
10
- - -5 cm below surface
- - - . -10 cm below surface
0'
8
~
6
I4
2
0
Q) 0
u
co
't:
:J -10
(/)
E
0 -20
'- - water table
....
E -30
£
- - - - permafrost boundary
,
..c:
- -40
a.
- - - .....
Q)
"0
- - - - - - - - - - - -
-50
25. July
05. Aug.
15. Aug.
25. Aug.
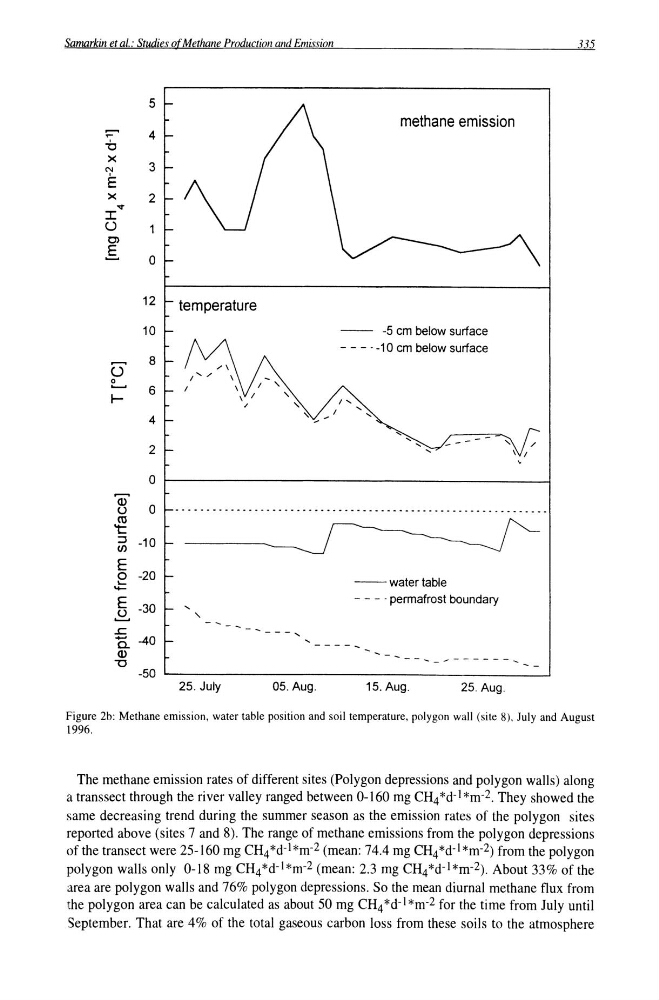
Figure 2b: Methane emission, water table position and soil temperature, polygon wall (site 8), July and August
1996.
The methane emission rates of different sites (Polygon depressions and polygon walls) along
a trans sect through the river valley ranged between 0-160 mg CH 4 *d- 1 *m- 2 . They showed the
same decreasing trend during the summer season as the emission rates of the polygon sites
reported above (sites 7 and 8). The range of methane emissions from the polygon depressions
of the transect were 25-160 mg CH 4 *d- h m- 2 (mean: 74.4 mg CH 4 *d- l *m- 2 ) from the polygon
polygon walls only 0-18 mg CH 4 *d- l *m- 2 (mean: 2.3 mg CH 4 *d- l *m- 2 ). About 33% of the
area are polygon walls and 76% polygon depressions. So the mean diurnal methane flux from
the polygon area can be calculated as about 50 mg CH 4 *d- I *m-2 for the time from July until
September. That are 4% of the total gaseous carbon loss from these soils to the atmosphere
335
5
methane emission
~
4
~
-b
><
3
N
E
><
2
v
I
U
Cl
oS 0
12
temperature
10
- - -5 cm below surface
- - - . -10 cm below surface
0'
8
~
6
I4
2
0
Q) 0
u
co
't:
:J -10
(/)
E
0 -20
'- - water table
....
E -30
£
- - - - permafrost boundary
,
..c:
- -40
a.
- - - .....
Q)
"0
- - - - - - - - - - - -
-50
25. July
05. Aug.
15. Aug.
25. Aug.
Figure 2b: Methane emission, water table position and soil temperature, polygon wall (site 8), July and August
1996.
The methane emission rates of different sites (Polygon depressions and polygon walls) along
a trans sect through the river valley ranged between 0-160 mg CH 4 *d- 1 *m- 2 . They showed the
same decreasing trend during the summer season as the emission rates of the polygon sites
reported above (sites 7 and 8). The range of methane emissions from the polygon depressions
of the transect were 25-160 mg CH 4 *d- h m- 2 (mean: 74.4 mg CH 4 *d- l *m- 2 ) from the polygon
polygon walls only 0-18 mg CH 4 *d- l *m- 2 (mean: 2.3 mg CH 4 *d- l *m- 2 ). About 33% of the
area are polygon walls and 76% polygon depressions. So the mean diurnal methane flux from
the polygon area can be calculated as about 50 mg CH 4 *d- I *m-2 for the time from July until
September. That are 4% of the total gaseous carbon loss from these soils to the atmosphere