

334
Land-Ocean Systems in the Siberian Arctic: Dynamics and History
120
methane emission
....... 100
~
-b
x
80
'i'
E
60
x ....
I
40
U
Cl
§. 20
0
12
temperature
- - -5 cm below surface
9
- - - - -1 0 cm below surface
IT
::......
I6
I
I
\
I
~
3
~
~ -
-
\
/
"
.........
0
<1>
U
ro
0
't:
:J
I/) -10
E
- - water table
0
- - - - permafrost boundary
L-20
'tE
- - - - - -
.£ -30
..c
- - - - - - - - - - -
-- Cl. -40
<1>
"0
-50
25. July
05. Aug.
15. Aug.
25. Aug.
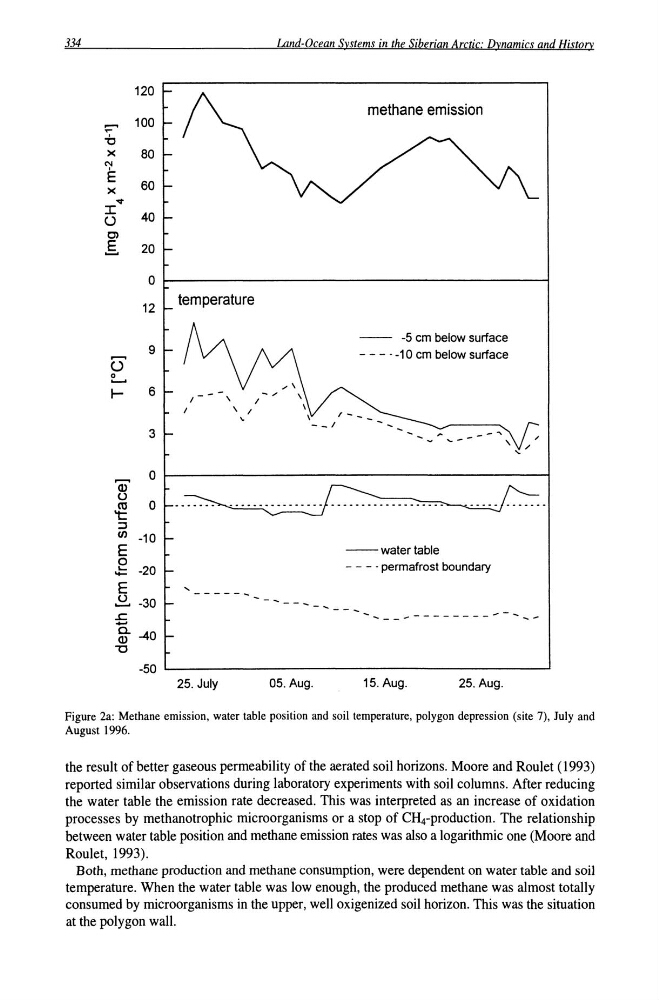
Figure 2a: Methane emission, water table position and soil temperature, polygon depression (site 7), July and
August 1996.
the result of better gaseous permeability of the aerated soil horizons. Moore and Roulet (1993)
reported similar observations during laboratory experiments with soil columns. After reducing
the water table the emission rate decreased. This was interpreted as an increase of oxidation
processes by methanotrophic microorganisms or a stop of CH4-production. The relationship
between water table position and methane emission rates was also a logarithmic one (Moore and
Roulet, 1993).
Both, methane production and methane consumption, were dependent on water table and soil
temperature. When the water table was low enough, the produced methane was almost totally
consumed by microorganisms in the upper, well oxigenized soil horizon. This was the situation
at the polygon wall.
Land-Ocean Systems in the Siberian Arctic: Dynamics and History
120
methane emission
....... 100
~
-b
x
80
'i'
E
60
x ....
I
40
U
Cl
§. 20
0
12
temperature
- - -5 cm below surface
9
- - - - -1 0 cm below surface
IT
::......
I6
I
I
\
I
~
3
~
~ -
-
\
/
"
.........
0
<1>
U
ro
0
't:
:J
I/) -10
E
- - water table
0
- - - - permafrost boundary
L-20
'tE
- - - - - -
.£ -30
..c
- - - - - - - - - - -
-- Cl. -40
<1>
"0
-50
25. July
05. Aug.
15. Aug.
25. Aug.
Figure 2a: Methane emission, water table position and soil temperature, polygon depression (site 7), July and
August 1996.
the result of better gaseous permeability of the aerated soil horizons. Moore and Roulet (1993)
reported similar observations during laboratory experiments with soil columns. After reducing
the water table the emission rate decreased. This was interpreted as an increase of oxidation
processes by methanotrophic microorganisms or a stop of CH4-production. The relationship
between water table position and methane emission rates was also a logarithmic one (Moore and
Roulet, 1993).
Both, methane production and methane consumption, were dependent on water table and soil
temperature. When the water table was low enough, the produced methane was almost totally
consumed by microorganisms in the upper, well oxigenized soil horizon. This was the situation
at the polygon wall.