

Rachold: Major Trace and Rare Earth Element Geochemistry
209
~
o
..(a)
0.65
0.6
0.55
• 0.5
~
::J 0.45
- - - - - - U1Alcalc. - - - -
~
0
..•
«
-- .c f0.35
0.3L-+-~~~--L-~~~~~--~~~~-¥--L-~~~~~--~~~~
delta ,pipe'
lower
middle
upper
2.5r-+-~~~--r-~~-r-.-,--~~-r-r-h--r-.-~-r-,~--.-'-~-,
(b)
2
1.5
Vilyuy (L3)
confluence Aldan (L2)
confluence
Chara (L 1)
confluence
t
10L-~~~--~5~00~~~~~710=0~0~-w--~~1~5700~--~~~2~0~0~0~~--~~2~500
distance from Lena mouth (km)
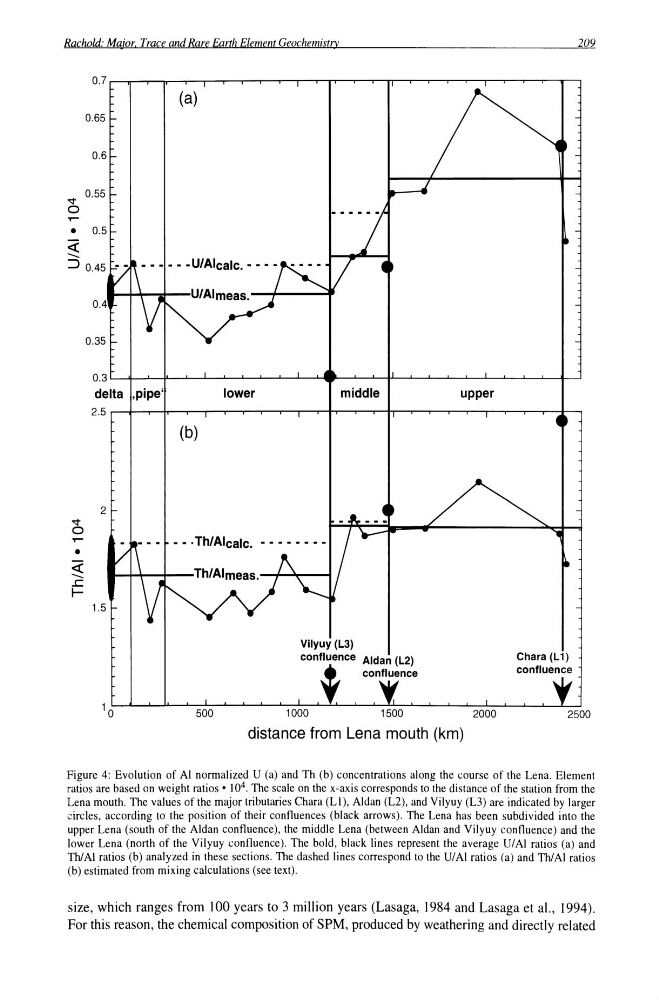
Figure 4: Evolution of AI normalized U (a) and Th (b) concentrations along the course of the Lena. Element
ratios are based on weight ratios' 10 4 The scale on the x-axis corresponds to the distance of the station from the
Lena mouth. The values of the major tributaries Chara (Ll), Aldan (L2), and Vilyuy (L3) are indicated by larger
drcles, according to the position of their confluences (black arrows). The Lena has been subdivided into the
upper Lena (south of the Aldan confluence), the middle Lena (between Aldan and Vilyuy confluence) and the
lower Lena (north of the Vilyuy confluence). The bold, black lines represent the average U/AI ratios (al and
ThiAI ratios (b) analyzed in these sections. The dashed lines correspond to the U/AI ratios (a) and ThiAI ratios
(b) estimated from mixing calculations (see text).
size, which ranges from 100 years to 3 million years (Lasaga, 1984 and Lasaga et aI., 1994).
For this reason, the chemical composition of SPM, produced by weathering and directly related
209
~
o
..(a)
0.65
0.6
0.55
• 0.5
~
::J 0.45
- - - - - - U1Alcalc. - - - -
~
0
..•
«
-- .c f0.35
0.3L-+-~~~--L-~~~~~--~~~~-¥--L-~~~~~--~~~~
delta ,pipe'
lower
middle
upper
2.5r-+-~~~--r-~~-r-.-,--~~-r-r-h--r-.-~-r-,~--.-'-~-,
(b)
2
1.5
Vilyuy (L3)
confluence Aldan (L2)
confluence
Chara (L 1)
confluence
t
10L-~~~--~5~00~~~~~710=0~0~-w--~~1~5700~--~~~2~0~0~0~~--~~2~500
distance from Lena mouth (km)
Figure 4: Evolution of AI normalized U (a) and Th (b) concentrations along the course of the Lena. Element
ratios are based on weight ratios' 10 4 The scale on the x-axis corresponds to the distance of the station from the
Lena mouth. The values of the major tributaries Chara (Ll), Aldan (L2), and Vilyuy (L3) are indicated by larger
drcles, according to the position of their confluences (black arrows). The Lena has been subdivided into the
upper Lena (south of the Aldan confluence), the middle Lena (between Aldan and Vilyuy confluence) and the
lower Lena (north of the Vilyuy confluence). The bold, black lines represent the average U/AI ratios (al and
ThiAI ratios (b) analyzed in these sections. The dashed lines correspond to the U/AI ratios (a) and ThiAI ratios
(b) estimated from mixing calculations (see text).
size, which ranges from 100 years to 3 million years (Lasaga, 1984 and Lasaga et aI., 1994).
For this reason, the chemical composition of SPM, produced by weathering and directly related