

v. Juterzenka and Knickmeier: Chlorophyll a Distribution in Water Column and Sea Ice
155
105· E 75
11000
115'"
120"
125"
130"
135"
140(1
145" E
7ao N
--=
78" N
• October 1995
August/September 1993
77"
n "
76"
76"
7S"
75"
74'
b
74"
Chi a (mg m-2)
73'
20
73"
(integrated aver
15
thB entire waler
column)
7'2:'
1072"
5
71· N
0
71 · N
10S" E
110'
115\ 10
120'
125"
130"
135·
140"
145" E
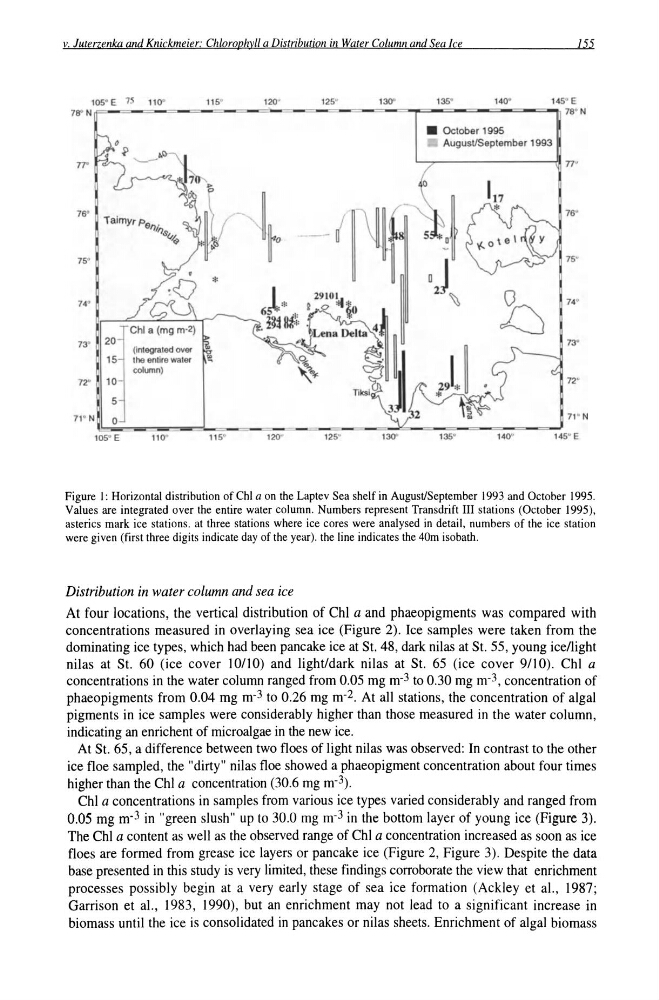
Figure I: Horizontal distribution of Chi a on the Laptev Sea shelf in August/September 1993 and October 1995.
Values are integrated over the entire water column. Numbers represent Transdrift III stations (October 1995),
asterics mark ice stations. at three stations where ice cores were analysed in detail, numbers of the ice station
were given (first three digits indicate day of the year). the line indicates the 40m isobath.
Distribution in water column and sea ice
At four locations, the vertical distribution of Chi a and phaeopigments was compared with
concentrations measured in overlaying sea ice (Figure 2). Ice samples were taken from the
dominating ice types, which had been pancake ice at St. 48, dark nilas at St. 55, young ice/light
nilas at St. 60 (ice cover 10/10) and light/dark nilas at St. 65 (ice cover 9/10). ChI a
concentrations in the water column ranged from 0.05 mg m- 3 to 0.30 mg m- 3 , concentration of
phaeopigments from 0.04 mg m- 3 to 0.26 mg m- 2 . At all stations, the concentration of algal
pigments in ice samples were considerably higher than those measured in the water column,
indicating an enrichent of microalgae in the new ice.
At st. 65, a difference between two floes of light nil as was observed: In contrast to the other
ice floe sampled, the "dirty" nilas floe showed a phaeopigment concentration about four times
higher than the Chi a concentration (30.6 mg m- 3 ).
Chi a concentrations in samples from various ice types varied considerably and ranged from
0.05 mg m- 3 in "green slush" up to 30.0 mg m- 3 in the bottom layer of young ice (Figure 3).
The Chi a content as well as the observed range of Chi a concentration increased as soon as ice
floes are formed from grease ice layers or pancake ice (Figure 2, Figure 3). Despite the data
base presented in this study is very limited, these findings corroborate the view that enrichment
processes possibly begin at a very early stage of sea ice formation (Ackley et a!., 1987;
Garrison et a!., 1983, 1990), but an enrichment may not lead to a significant increase in
biomass until the ice is consolidated in pancakes or nilas sheets. Enrichment of algal biomass
155
105· E 75
11000
115'"
120"
125"
130"
135"
140(1
145" E
7ao N
--=
78" N
• October 1995
August/September 1993
77"
n "
76"
76"
7S"
75"
74'
b
74"
Chi a (mg m-2)
73'
20
73"
(integrated aver
15
thB entire waler
column)
7'2:'
1072"
5
71· N
0
71 · N
10S" E
110'
115\ 10
120'
125"
130"
135·
140"
145" E
Figure I: Horizontal distribution of Chi a on the Laptev Sea shelf in August/September 1993 and October 1995.
Values are integrated over the entire water column. Numbers represent Transdrift III stations (October 1995),
asterics mark ice stations. at three stations where ice cores were analysed in detail, numbers of the ice station
were given (first three digits indicate day of the year). the line indicates the 40m isobath.
Distribution in water column and sea ice
At four locations, the vertical distribution of Chi a and phaeopigments was compared with
concentrations measured in overlaying sea ice (Figure 2). Ice samples were taken from the
dominating ice types, which had been pancake ice at St. 48, dark nilas at St. 55, young ice/light
nilas at St. 60 (ice cover 10/10) and light/dark nilas at St. 65 (ice cover 9/10). ChI a
concentrations in the water column ranged from 0.05 mg m- 3 to 0.30 mg m- 3 , concentration of
phaeopigments from 0.04 mg m- 3 to 0.26 mg m- 2 . At all stations, the concentration of algal
pigments in ice samples were considerably higher than those measured in the water column,
indicating an enrichent of microalgae in the new ice.
At st. 65, a difference between two floes of light nil as was observed: In contrast to the other
ice floe sampled, the "dirty" nilas floe showed a phaeopigment concentration about four times
higher than the Chi a concentration (30.6 mg m- 3 ).
Chi a concentrations in samples from various ice types varied considerably and ranged from
0.05 mg m- 3 in "green slush" up to 30.0 mg m- 3 in the bottom layer of young ice (Figure 3).
The Chi a content as well as the observed range of Chi a concentration increased as soon as ice
floes are formed from grease ice layers or pancake ice (Figure 2, Figure 3). Despite the data
base presented in this study is very limited, these findings corroborate the view that enrichment
processes possibly begin at a very early stage of sea ice formation (Ackley et a!., 1987;
Garrison et a!., 1983, 1990), but an enrichment may not lead to a significant increase in
biomass until the ice is consolidated in pancakes or nilas sheets. Enrichment of algal biomass