

molecule in the submarine environment is methane, but
also hydrates containing high-order hydrocarbons, carbon
dioxide, hydrogen sulfide, or other gas may exist. Gas
hydrates occur naturally in the pore space of different
types of marine sediments, where appropriate highpressure and low-temperature conditions exist and there
is an adequate supply of gas and water (Figure 2)
(Kvenvolden, 1993; Rempel and Buffett, 1997; Sloan,
2003). Those requirements confine marine gas hydrates
to the upper few hundred meters of the shallow geosphere
of continental margins, where biogenic processes produce
sufficient amounts of methane gas. The gas hydraterelated BSR detected on marine seismic reflection data
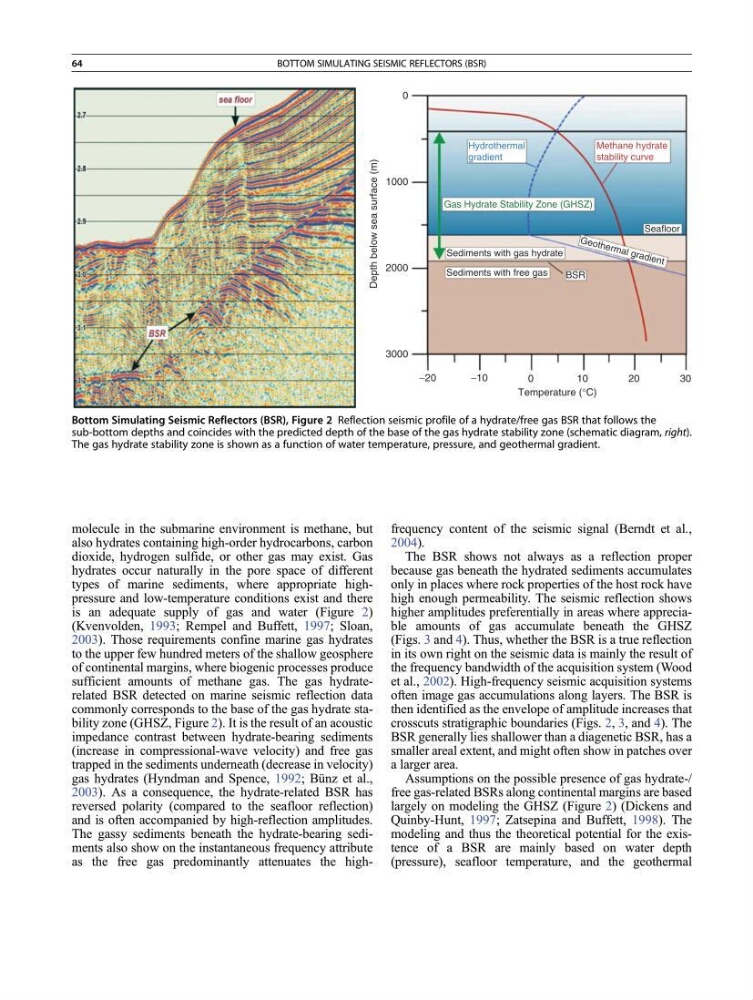
commonly corresponds to the base of the gas hydrate stability zone (GHSZ, Figure 2). It is the result of an acoustic
impedance contrast between hydrate-bearing sediments
(increase in compressional-wave velocity) and free gas
trapped in the sediments underneath (decrease in velocity)
gas hydrates (Hyndman and Spence, 1992; Bünz et al.,
2003). As a consequence, the hydrate-related BSR has
reversed polarity (compared to the seafloor reflection)
and is often accompanied by high-reflection amplitudes.
The gassy sediments beneath the hydrate-bearing sediments also show on the instantaneous frequency attribute
as the free gas predominantly attenuates the highfrequency content of the seismic signal (Berndt et al.,
2004).
The BSR shows not always as a reflection proper
because gas beneath the hydrated sediments accumulates
only in places where rock properties of the host rock have
high enough permeability. The seismic reflection shows
higher amplitudes preferentially in areas where appreciable amounts of gas accumulate beneath the GHSZ
(Figs. 3 and 4). Thus, whether the BSR is a true reflection
in its own right on the seismic data is mainly the result of
the frequency bandwidth of the acquisition system (Wood
et al., 2002). High-frequency seismic acquisition systems
often image gas accumulations along layers. The BSR is
then identified as the envelope of amplitude increases that
crosscuts stratigraphic boundaries (Figs. 2, 3, and 4). The
BSR generally lies shallower than a diagenetic BSR, has a
smaller areal extent, and might often show in patches over
a larger area.
Assumptions on the possible presence of gas hydrate-/
free gas-related BSRs along continental margins are based
largely on modeling the GHSZ (Figure 2) (Dickens and
Quinby-Hunt, 1997; Zatsepina and Buffett, 1998). The
modeling and thus the theoretical potential for the existence of a BSR are mainly based on water depth
(pressure), seafloor temperature, and the geothermal
0
1000
2000
Sediments with free gas
BSR
Gas Hydrate Stability Zone (GHSZ)
Hydrothermal
gradient
Methane hydrate
stability curve
G e o th e rm a l g ra d ie n t
Seafloor
Sediments with gas hydrate
Depth below sea surface (m)
3000
−20
−10
0
1 0
Temperature (°C)
20
30
Bottom Simulating Seismic Reflectors (BSR), Figure 2 Reflection seismic profile of a hydrate/free gas BSR that follows the
sub-bottom depths and coincides with the predicted depth of the base of the gas hydrate stability zone (schematic diagram, right).
The gas hydrate stability zone is shown as a function of water temperature, pressure, and geothermal gradient.
64
BOTTOM SIMULATING SEISMIC REFLECTORS (BSR)
also hydrates containing high-order hydrocarbons, carbon
dioxide, hydrogen sulfide, or other gas may exist. Gas
hydrates occur naturally in the pore space of different
types of marine sediments, where appropriate highpressure and low-temperature conditions exist and there
is an adequate supply of gas and water (Figure 2)
(Kvenvolden, 1993; Rempel and Buffett, 1997; Sloan,
2003). Those requirements confine marine gas hydrates
to the upper few hundred meters of the shallow geosphere
of continental margins, where biogenic processes produce
sufficient amounts of methane gas. The gas hydraterelated BSR detected on marine seismic reflection data
commonly corresponds to the base of the gas hydrate stability zone (GHSZ, Figure 2). It is the result of an acoustic
impedance contrast between hydrate-bearing sediments
(increase in compressional-wave velocity) and free gas
trapped in the sediments underneath (decrease in velocity)
gas hydrates (Hyndman and Spence, 1992; Bünz et al.,
2003). As a consequence, the hydrate-related BSR has
reversed polarity (compared to the seafloor reflection)
and is often accompanied by high-reflection amplitudes.
The gassy sediments beneath the hydrate-bearing sediments also show on the instantaneous frequency attribute
as the free gas predominantly attenuates the highfrequency content of the seismic signal (Berndt et al.,
2004).
The BSR shows not always as a reflection proper
because gas beneath the hydrated sediments accumulates
only in places where rock properties of the host rock have
high enough permeability. The seismic reflection shows
higher amplitudes preferentially in areas where appreciable amounts of gas accumulate beneath the GHSZ
(Figs. 3 and 4). Thus, whether the BSR is a true reflection
in its own right on the seismic data is mainly the result of
the frequency bandwidth of the acquisition system (Wood
et al., 2002). High-frequency seismic acquisition systems
often image gas accumulations along layers. The BSR is
then identified as the envelope of amplitude increases that
crosscuts stratigraphic boundaries (Figs. 2, 3, and 4). The
BSR generally lies shallower than a diagenetic BSR, has a
smaller areal extent, and might often show in patches over
a larger area.
Assumptions on the possible presence of gas hydrate-/
free gas-related BSRs along continental margins are based
largely on modeling the GHSZ (Figure 2) (Dickens and
Quinby-Hunt, 1997; Zatsepina and Buffett, 1998). The
modeling and thus the theoretical potential for the existence of a BSR are mainly based on water depth
(pressure), seafloor temperature, and the geothermal
0
1000
2000
Sediments with free gas
BSR
Gas Hydrate Stability Zone (GHSZ)
Hydrothermal
gradient
Methane hydrate
stability curve
G e o th e rm a l g ra d ie n t
Seafloor
Sediments with gas hydrate
Depth below sea surface (m)
3000
−20
−10
0
1 0
Temperature (°C)
20
30
Bottom Simulating Seismic Reflectors (BSR), Figure 2 Reflection seismic profile of a hydrate/free gas BSR that follows the
sub-bottom depths and coincides with the predicted depth of the base of the gas hydrate stability zone (schematic diagram, right).
The gas hydrate stability zone is shown as a function of water temperature, pressure, and geothermal gradient.
64
BOTTOM SIMULATING SEISMIC REFLECTORS (BSR)