

As the igneous crust becomes covered by sediment,
direct flow between the oceans and lithosphere is cutoff.
In extensively sedimented regions (Figure 2bc), heat flow
may recover to near background values (Davis et al.,
1999). However, flow may still occur between igneous
outcrops, extracting heat beneath regions well covered
by sediment for several tens of kilometers (Davis et al.,
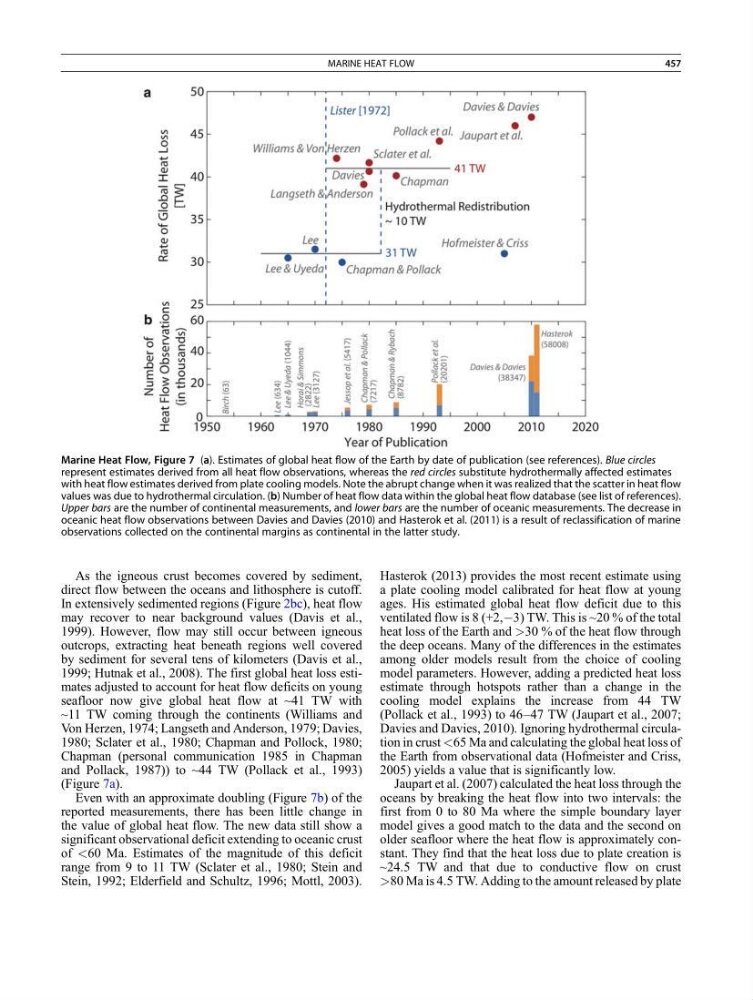
1999; Hutnak et al., 2008). The first global heat loss estimates adjusted to account for heat flow deficits on young
seafloor now give global heat flow at ~41 TW with
~11 TW coming through the continents (Williams and
Von Herzen, 1974; Langseth and Anderson, 1979; Davies,
1980; Sclater et al., 1980; Chapman and Pollock, 1980;
Chapman (personal communication 1985 in Chapman
and Pollack, 1987)) to ~44 TW (Pollack et al., 1993)
(Figure 7a).
Even with an approximate doubling (Figure 7b) of the
reported measurements, there has been little change in
the value of global heat flow. The new data still show a
significant observational deficit extending to oceanic crust
of <60 Ma. Estimates of the magnitude of this deficit
range from 9 to 11 TW (Sclater et al., 1980; Stein and
Stein, 1992; Elderfield and Schultz, 1996; Mottl, 2003).
Hasterok (2013) provides the most recent estimate using
a plate cooling model calibrated for heat flow at young
ages. His estimated global heat flow deficit due to this
ventilated flow is 8 (+2,À3) TW. This is ~20 % of the total
heat loss of the Earth and >30 % of the heat flow through
the deep oceans. Many of the differences in the estimates
among older models result from the choice of cooling
model parameters. However, adding a predicted heat loss
estimate through hotspots rather than a change in the
cooling model explains the increase from 44 TW
(Pollack et al., 1993) to 46–47 TW (Jaupart et al., 2007;
Davies and Davies, 2010). Ignoring hydrothermal circulation in crust <65 Ma and calculating the global heat loss of
the Earth from observational data (Hofmeister and Criss,
2005) yields a value that is significantly low.
Jaupart et al. (2007) calculated the heat loss through the
oceans by breaking the heat flow into two intervals: the
first from 0 to 80 Ma where the simple boundary layer
model gives a good match to the data and the second on
older seafloor where the heat flow is approximately constant. They find that the heat loss due to plate creation is
~24.5 TW and that due to conductive flow on crust
>80 Ma is 4.5 TW. Adding to the amount released by plate
Marine Heat Flow, Figure 7 (a). Estimates of global heat flow of the Earth by date of publication (see references). Blue circles
represent estimates derived from all heat flow observations, whereas the red circles substitute hydrothermally affected estimates
with heat flow estimates derived from plate cooling models. Note the abrupt change when it was realized that the scatter in heat flow
values was due to hydrothermal circulation. (b) Number of heat flow data within the global heat flow database (see list of references).
Upper bars are the number of continental measurements, and lower bars are the number of oceanic measurements. The decrease in
oceanic heat flow observations between Davies and Davies (2010) and Hasterok et al. (2011) is a result of reclassification of marine
observations collected on the continental margins as continental in the latter study.
MARINE HEAT FLOW
457
direct flow between the oceans and lithosphere is cutoff.
In extensively sedimented regions (Figure 2bc), heat flow
may recover to near background values (Davis et al.,
1999). However, flow may still occur between igneous
outcrops, extracting heat beneath regions well covered
by sediment for several tens of kilometers (Davis et al.,
1999; Hutnak et al., 2008). The first global heat loss estimates adjusted to account for heat flow deficits on young
seafloor now give global heat flow at ~41 TW with
~11 TW coming through the continents (Williams and
Von Herzen, 1974; Langseth and Anderson, 1979; Davies,
1980; Sclater et al., 1980; Chapman and Pollock, 1980;
Chapman (personal communication 1985 in Chapman
and Pollack, 1987)) to ~44 TW (Pollack et al., 1993)
(Figure 7a).
Even with an approximate doubling (Figure 7b) of the
reported measurements, there has been little change in
the value of global heat flow. The new data still show a
significant observational deficit extending to oceanic crust
of <60 Ma. Estimates of the magnitude of this deficit
range from 9 to 11 TW (Sclater et al., 1980; Stein and
Stein, 1992; Elderfield and Schultz, 1996; Mottl, 2003).
Hasterok (2013) provides the most recent estimate using
a plate cooling model calibrated for heat flow at young
ages. His estimated global heat flow deficit due to this
ventilated flow is 8 (+2,À3) TW. This is ~20 % of the total
heat loss of the Earth and >30 % of the heat flow through
the deep oceans. Many of the differences in the estimates
among older models result from the choice of cooling
model parameters. However, adding a predicted heat loss
estimate through hotspots rather than a change in the
cooling model explains the increase from 44 TW
(Pollack et al., 1993) to 46–47 TW (Jaupart et al., 2007;
Davies and Davies, 2010). Ignoring hydrothermal circulation in crust <65 Ma and calculating the global heat loss of
the Earth from observational data (Hofmeister and Criss,
2005) yields a value that is significantly low.
Jaupart et al. (2007) calculated the heat loss through the
oceans by breaking the heat flow into two intervals: the
first from 0 to 80 Ma where the simple boundary layer
model gives a good match to the data and the second on
older seafloor where the heat flow is approximately constant. They find that the heat loss due to plate creation is
~24.5 TW and that due to conductive flow on crust
>80 Ma is 4.5 TW. Adding to the amount released by plate
Marine Heat Flow, Figure 7 (a). Estimates of global heat flow of the Earth by date of publication (see references). Blue circles
represent estimates derived from all heat flow observations, whereas the red circles substitute hydrothermally affected estimates
with heat flow estimates derived from plate cooling models. Note the abrupt change when it was realized that the scatter in heat flow
values was due to hydrothermal circulation. (b) Number of heat flow data within the global heat flow database (see list of references).
Upper bars are the number of continental measurements, and lower bars are the number of oceanic measurements. The decrease in
oceanic heat flow observations between Davies and Davies (2010) and Hasterok et al. (2011) is a result of reclassification of marine
observations collected on the continental margins as continental in the latter study.
MARINE HEAT FLOW
457