

(Smith and Sandwell, 1997). Today the spatial resolution
of the satellite altimetry-derived gravity maps of the
world’s oceans as well as the constructed bathymetry is
better than 20 km. Ship-based measurements reach significantly higher resolutions; however, they are only available along ship tracks and small areas which have been
surveyed systematically but cover only a fraction of the
oceans. Since to date all satellite missions measuring the
gravity field have been flown at an orbital inclination,
gaps still exist in high polar regions where little or no gravity data are available.
Marine gravity and tectonics
For marine geosciences, the gravity field provides a
wealth of information related to tectonics regionally and
globally (Figure 2). The large structures of the
mid-ocean ridges became visible in the gravity maps for
the first time thus confirming the concept of plate tectonics
(Haxby et al., 1983; Smith, 1998). Thousands of seamounts could be detected by their local gravity anomalies
and reveal plate boundaries, magmatic processes associated to hot spots, plate motions, and others (Craig and
Sandwell, 1988). Where both gravity and independently
measured bathymetry data exist, gravity anomalies not
directly related to the seafloor topography indicate density
contrasts within the Earth’s crust. These can be modeled in
order to get insight into geologic structures at plate boundaries and other places where the geology is more complex.
Areas which are out of isostatic equilibrium due to uplift
or depression also become visible in the gravity field. Typically a combination of gravity, magnetic, seismic, and
bathymetric data is used for integrated studies in marine
geosciences. In the case of the gravity field, satellitederived data with full spatial coverage of the longer wavelengths and high-resolution shipboard data supplement
each other.
Bibliography
Craig, C. H., and Sandwell, D. T., 1988. Global distribution of seamounts from Seasat profiles. Journal of Geophysical Research,
93, 10408–10420.
Haxby, W. F., Karner, G. D., LaBrecque, J. L., and Weissel, J. K.,
1983. Digital images of combined oceanic and continental data
sets and their use in tectonic studies. EOS Transactions American Geophysical Union, 64(52), 995–1004.
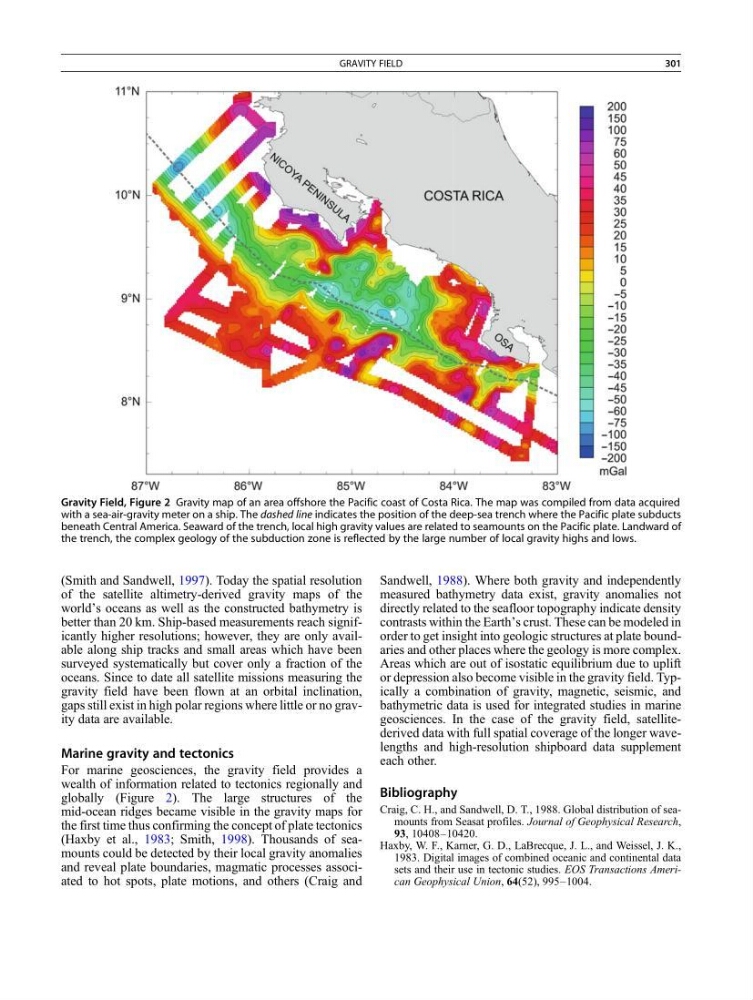
Gravity Field, Figure 2 Gravity map of an area offshore the Pacific coast of Costa Rica. The map was compiled from data acquired
with a sea-air-gravity meter on a ship. The dashed line indicates the position of the deep-sea trench where the Pacific plate subducts
beneath Central America. Seaward of the trench, local high gravity values are related to seamounts on the Pacific plate. Landward of
the trench, the complex geology of the subduction zone is reflected by the large number of local gravity highs and lows.
GRAVITY FIELD
301
of the satellite altimetry-derived gravity maps of the
world’s oceans as well as the constructed bathymetry is
better than 20 km. Ship-based measurements reach significantly higher resolutions; however, they are only available along ship tracks and small areas which have been
surveyed systematically but cover only a fraction of the
oceans. Since to date all satellite missions measuring the
gravity field have been flown at an orbital inclination,
gaps still exist in high polar regions where little or no gravity data are available.
Marine gravity and tectonics
For marine geosciences, the gravity field provides a
wealth of information related to tectonics regionally and
globally (Figure 2). The large structures of the
mid-ocean ridges became visible in the gravity maps for
the first time thus confirming the concept of plate tectonics
(Haxby et al., 1983; Smith, 1998). Thousands of seamounts could be detected by their local gravity anomalies
and reveal plate boundaries, magmatic processes associated to hot spots, plate motions, and others (Craig and
Sandwell, 1988). Where both gravity and independently
measured bathymetry data exist, gravity anomalies not
directly related to the seafloor topography indicate density
contrasts within the Earth’s crust. These can be modeled in
order to get insight into geologic structures at plate boundaries and other places where the geology is more complex.
Areas which are out of isostatic equilibrium due to uplift
or depression also become visible in the gravity field. Typically a combination of gravity, magnetic, seismic, and
bathymetric data is used for integrated studies in marine
geosciences. In the case of the gravity field, satellitederived data with full spatial coverage of the longer wavelengths and high-resolution shipboard data supplement
each other.
Bibliography
Craig, C. H., and Sandwell, D. T., 1988. Global distribution of seamounts from Seasat profiles. Journal of Geophysical Research,
93, 10408–10420.
Haxby, W. F., Karner, G. D., LaBrecque, J. L., and Weissel, J. K.,
1983. Digital images of combined oceanic and continental data
sets and their use in tectonic studies. EOS Transactions American Geophysical Union, 64(52), 995–1004.
Gravity Field, Figure 2 Gravity map of an area offshore the Pacific coast of Costa Rica. The map was compiled from data acquired
with a sea-air-gravity meter on a ship. The dashed line indicates the position of the deep-sea trench where the Pacific plate subducts
beneath Central America. Seaward of the trench, local high gravity values are related to seamounts on the Pacific plate. Landward of
the trench, the complex geology of the subduction zone is reflected by the large number of local gravity highs and lows.
GRAVITY FIELD
301