

sluggish environment that had always been cold. The first
estimates of the velocities of currents in the deep sea came
in the 1950s through analysis on the data collected by the
German “Meteor” expedition of 1925–1927, revealing
that current velocities of the deep western boundary currents ranged between 2 and 18 cm/s.
It was only after the recovery of extensive sediment
cores by the DSDP that it became evident that the record
was one not only of changing conditions over the past
180 million years, but that there were many gaps in the
record caused by erosion and redeposition by bottom currents. As sonic swath mapping of the seafloor proceeded,
it was realized that there are many bottom features, such
as sediment drifts, sand sheets, dunes, gravel bars, and
scour marks that reflect the activity of bottom currents.
The overall pattern of deep-sea erosion and
deposition
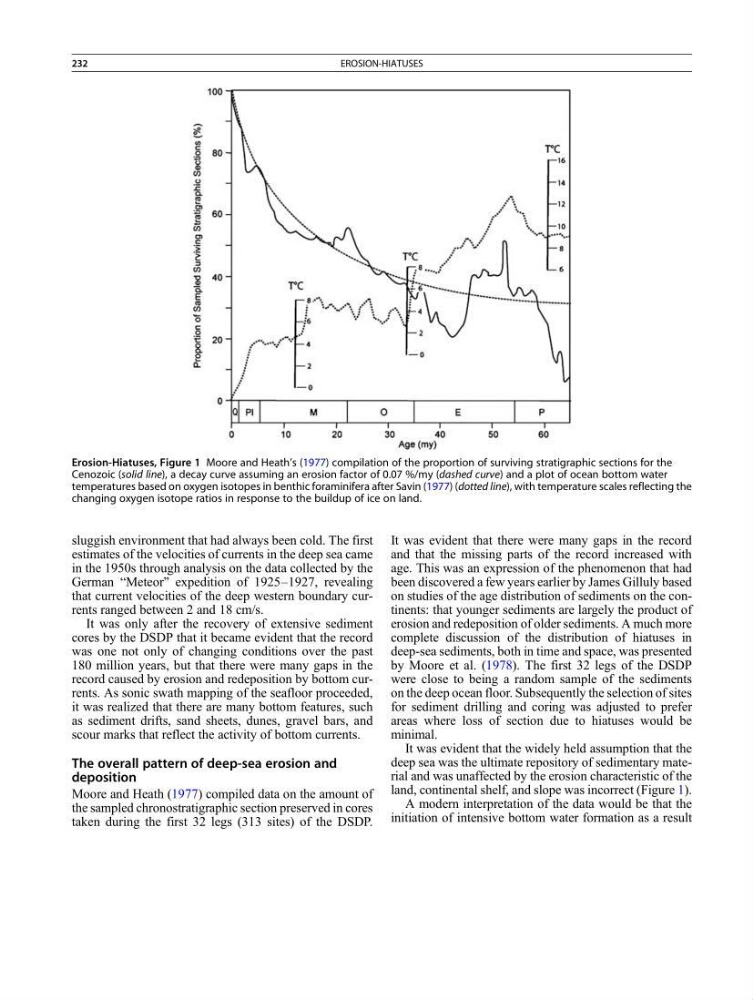
Moore and Heath (1977) compiled data on the amount of
the sampled chronostratigraphic section preserved in cores
taken during the first 32 legs (313 sites) of the DSDP.
It was evident that there were many gaps in the record
and that the missing parts of the record increased with
age. This was an expression of the phenomenon that had
been discovered a few years earlier by James Gilluly based
on studies of the age distribution of sediments on the continents: that younger sediments are largely the product of
erosion and redeposition of older sediments. A much more
complete discussion of the distribution of hiatuses in
deep-sea sediments, both in time and space, was presented
by Moore et al. (1978). The first 32 legs of the DSDP
were close to being a random sample of the sediments
on the deep ocean floor. Subsequently the selection of sites
for sediment drilling and coring was adjusted to prefer
areas where loss of section due to hiatuses would be
minimal.
It was evident that the widely held assumption that the
deep sea was the ultimate repository of sedimentary material and was unaffected by the erosion characteristic of the
land, continental shelf, and slope was incorrect (Figure 1).
A modern interpretation of the data would be that the
initiation of intensive bottom water formation as a result
Erosion-Hiatuses, Figure 1 Moore and Heath’s (1977) compilation of the proportion of surviving stratigraphic sections for the
Cenozoic (solid line), a decay curve assuming an erosion factor of 0.07 %/my (dashed curve) and a plot of ocean bottom water
temperatures based on oxygen isotopes in benthic foraminifera after Savin (1977) (dotted line), with temperature scales reflecting the
changing oxygen isotope ratios in response to the buildup of ice on land.
232
EROSION-HIATUSES
estimates of the velocities of currents in the deep sea came
in the 1950s through analysis on the data collected by the
German “Meteor” expedition of 1925–1927, revealing
that current velocities of the deep western boundary currents ranged between 2 and 18 cm/s.
It was only after the recovery of extensive sediment
cores by the DSDP that it became evident that the record
was one not only of changing conditions over the past
180 million years, but that there were many gaps in the
record caused by erosion and redeposition by bottom currents. As sonic swath mapping of the seafloor proceeded,
it was realized that there are many bottom features, such
as sediment drifts, sand sheets, dunes, gravel bars, and
scour marks that reflect the activity of bottom currents.
The overall pattern of deep-sea erosion and
deposition
Moore and Heath (1977) compiled data on the amount of
the sampled chronostratigraphic section preserved in cores
taken during the first 32 legs (313 sites) of the DSDP.
It was evident that there were many gaps in the record
and that the missing parts of the record increased with
age. This was an expression of the phenomenon that had
been discovered a few years earlier by James Gilluly based
on studies of the age distribution of sediments on the continents: that younger sediments are largely the product of
erosion and redeposition of older sediments. A much more
complete discussion of the distribution of hiatuses in
deep-sea sediments, both in time and space, was presented
by Moore et al. (1978). The first 32 legs of the DSDP
were close to being a random sample of the sediments
on the deep ocean floor. Subsequently the selection of sites
for sediment drilling and coring was adjusted to prefer
areas where loss of section due to hiatuses would be
minimal.
It was evident that the widely held assumption that the
deep sea was the ultimate repository of sedimentary material and was unaffected by the erosion characteristic of the
land, continental shelf, and slope was incorrect (Figure 1).
A modern interpretation of the data would be that the
initiation of intensive bottom water formation as a result
Erosion-Hiatuses, Figure 1 Moore and Heath’s (1977) compilation of the proportion of surviving stratigraphic sections for the
Cenozoic (solid line), a decay curve assuming an erosion factor of 0.07 %/my (dashed curve) and a plot of ocean bottom water
temperatures based on oxygen isotopes in benthic foraminifera after Savin (1977) (dotted line), with temperature scales reflecting the
changing oxygen isotope ratios in response to the buildup of ice on land.
232
EROSION-HIATUSES