

plane orthogonal to it (Figure 1b). A positive (+; upward)
P-wave first motion observed in vertical component
records corresponds to a push away from the hypocenter
and thus to a seismic ray that has left the source in an
extensional quadrant, and vice versa an observed dilatational first motion (À; downward) to a compressional segment in the source volume. Thus, by plotting the azimuth
of the station to the hypocenter and its distance together
with the polarity of first motion (dark shaded area for compression, light colored areas for dilatational first motions,
cf. Figure 1c) on a stereogram, the two orthogonal great
circle lines that separate best the + À and –polarity data
points can be considered as the fault plane and its orthogonal auxiliary plane, from which both the strike and dip of
these planes but also the slip direction can be derived.
However, which of these two planes relates to the acting
fault plane cannot be inferred from polarity readings alone
but requires additional amplitude and frequency observations or independent field evidence. Moreover, existing
faults constitute planes of weakness that may be
reactivated in stress fields that are not optimally oriented
to the direction of maximum pressure and tension in the
source area, and as frictional strength of faults is less than
the stress necessary to form them, inferring the real stressfield orientation and the size of the deviatoric stresses
from the orientation of active faults or earthquake focal
mechanism is also ambiguous without additional information (Scholz, 2002).
The accuracy of the estimation of both the hypocenter
and the focal plane of an earthquake depends on the number of records studied from stations in different directions
and distances to the hypocenter. Therefore, since the
beginning of the twentieth century, global and local, permanent and temporary seismic networks have been
installed. This need made seismology play an important
role in leading the way for open data distribution. Nowadays, the scientific community does not only share
seismograms, but more and more permits also open access
in real time to digital recordings from stations worldwide
via the Internet.
Earthquake size and frequency
Earthquakes size and frequency of occurrence are
unevenly distributed in space and time, with small events
being much more common than the larger ones.
Earthquake size is both estimated in a qualitative way
based on observations like the amount of damage, felt
shaking or vibrating glasses, rattling doors, etc., and in a
more objective instrumentally measured quantitative way
in order to get a measure of seismic moment released or
seismic wave energy radiated by the seismic source independent on the distance of observations. The classification
of earthquake shaking effects is done by means of intensity scales, and that of the size of seismic sources by magnitude scales, respectively.
There exist several intensity scales, among them the
Modified Mercalli (MM) scale, which is mainly used in
the USA, and the European Macroseismic Scale (EMS).
Common to these scales is the definition of 12 degrees
through which increasing amounts of felt ground-shakingrelated phenomena and the degree of devastation is
described. Although these degrees and their description
are based on human observation and judgement, and thus
are somewhat subjective, the proper application of intensity scales yields reasonable results how to take into
account, e.g., different percentages of damage or different
amounts of vulnerability. Table 1 is intended to provide an
idea of the character of each intensity degree, but is far
from the detailed description of the MM or EMS (for more
details see, e.g., modern textbooks on geophysics like
Fowler, 2005, or Clauser, 2014, and references therein).
Moreover, macroseismic studies are the only way to estimate not only the size but also the epicenter and depth of
historical earthquakes, which occurred prior to the instrumental record. Therefore, the evaluation of epicentral
intensity and location of preinstrumental earthquakes
yields not only important data for more reliable long-term
seismic hazard estimates but related seismic intensity distribution maps for assessing differences in vulnerability
and seismic risk of settlement areas exposed to earthquake
shaking. Still older paleoearthquakes, which took place
before any human reporting can be identified through,
e.g., tsunami deposits, sand intrusions, fallen stalagmites,
and other co-called seismites (Goldfinger, 2011). If dated,
the area, which was affected by the same earthquake, can
be used to estimate its size. However, mostly, only major
and great earthquakes can be detected in these ways. If
several paleoearthquakes were identified and dated, e.g.,
through isotopic methods, in the same area, recurrence
intervals can be estimated (e.g., Cisternas et al., 2005).
In order to describe the size of an earthquake in a physically more meaningful way, modern magnitudes are calculated from instrumental measurements of either the
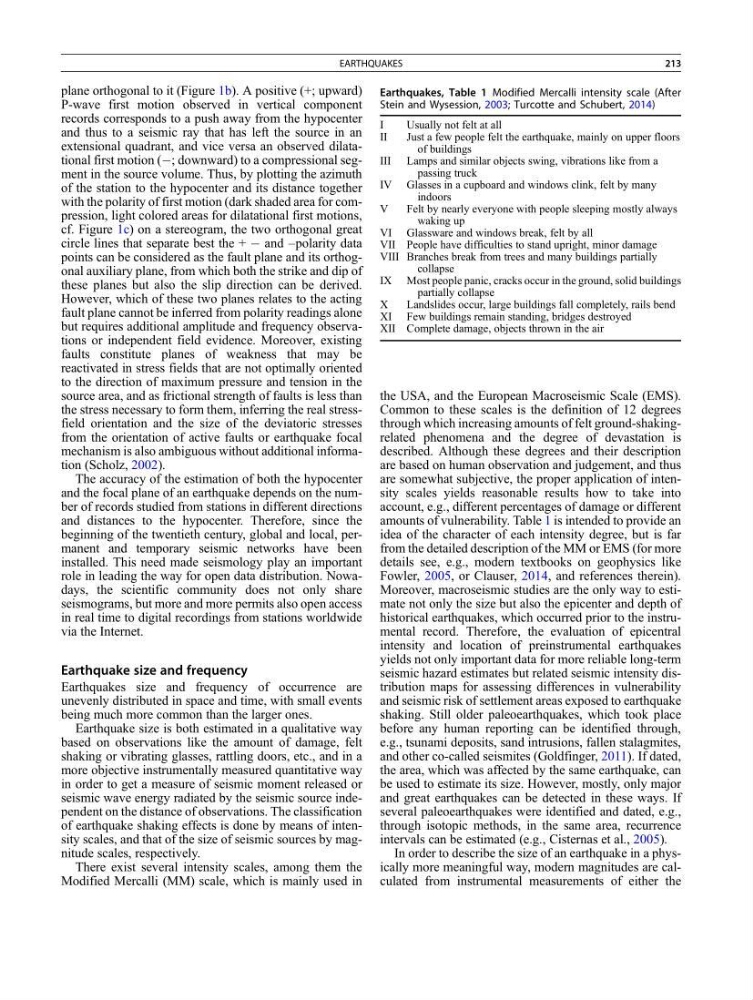
Earthquakes, Table 1 Modified Mercalli intensity scale (After
Stein and Wysession, 2003; Turcotte and Schubert, 2014)
I
Usually not felt at all
II
Just a few people felt the earthquake, mainly on upper floors
of buildings
III Lamps and similar objects swing, vibrations like from a
passing truck
IV Glasses in a cupboard and windows clink, felt by many
indoors
V
Felt by nearly everyone with people sleeping mostly always
waking up
VI Glassware and windows break, felt by all
VII People have difficulties to stand upright, minor damage
VIII Branches break from trees and many buildings partially
collapse
IX Most people panic, cracks occur in the ground, solid buildings
partially collapse
X
Landslides occur, large buildings fall completely, rails bend
XI Few buildings remain standing, bridges destroyed
XII Complete damage, objects thrown in the air
EARTHQUAKES
213
P-wave first motion observed in vertical component
records corresponds to a push away from the hypocenter
and thus to a seismic ray that has left the source in an
extensional quadrant, and vice versa an observed dilatational first motion (À; downward) to a compressional segment in the source volume. Thus, by plotting the azimuth
of the station to the hypocenter and its distance together
with the polarity of first motion (dark shaded area for compression, light colored areas for dilatational first motions,
cf. Figure 1c) on a stereogram, the two orthogonal great
circle lines that separate best the + À and –polarity data
points can be considered as the fault plane and its orthogonal auxiliary plane, from which both the strike and dip of
these planes but also the slip direction can be derived.
However, which of these two planes relates to the acting
fault plane cannot be inferred from polarity readings alone
but requires additional amplitude and frequency observations or independent field evidence. Moreover, existing
faults constitute planes of weakness that may be
reactivated in stress fields that are not optimally oriented
to the direction of maximum pressure and tension in the
source area, and as frictional strength of faults is less than
the stress necessary to form them, inferring the real stressfield orientation and the size of the deviatoric stresses
from the orientation of active faults or earthquake focal
mechanism is also ambiguous without additional information (Scholz, 2002).
The accuracy of the estimation of both the hypocenter
and the focal plane of an earthquake depends on the number of records studied from stations in different directions
and distances to the hypocenter. Therefore, since the
beginning of the twentieth century, global and local, permanent and temporary seismic networks have been
installed. This need made seismology play an important
role in leading the way for open data distribution. Nowadays, the scientific community does not only share
seismograms, but more and more permits also open access
in real time to digital recordings from stations worldwide
via the Internet.
Earthquake size and frequency
Earthquakes size and frequency of occurrence are
unevenly distributed in space and time, with small events
being much more common than the larger ones.
Earthquake size is both estimated in a qualitative way
based on observations like the amount of damage, felt
shaking or vibrating glasses, rattling doors, etc., and in a
more objective instrumentally measured quantitative way
in order to get a measure of seismic moment released or
seismic wave energy radiated by the seismic source independent on the distance of observations. The classification
of earthquake shaking effects is done by means of intensity scales, and that of the size of seismic sources by magnitude scales, respectively.
There exist several intensity scales, among them the
Modified Mercalli (MM) scale, which is mainly used in
the USA, and the European Macroseismic Scale (EMS).
Common to these scales is the definition of 12 degrees
through which increasing amounts of felt ground-shakingrelated phenomena and the degree of devastation is
described. Although these degrees and their description
are based on human observation and judgement, and thus
are somewhat subjective, the proper application of intensity scales yields reasonable results how to take into
account, e.g., different percentages of damage or different
amounts of vulnerability. Table 1 is intended to provide an
idea of the character of each intensity degree, but is far
from the detailed description of the MM or EMS (for more
details see, e.g., modern textbooks on geophysics like
Fowler, 2005, or Clauser, 2014, and references therein).
Moreover, macroseismic studies are the only way to estimate not only the size but also the epicenter and depth of
historical earthquakes, which occurred prior to the instrumental record. Therefore, the evaluation of epicentral
intensity and location of preinstrumental earthquakes
yields not only important data for more reliable long-term
seismic hazard estimates but related seismic intensity distribution maps for assessing differences in vulnerability
and seismic risk of settlement areas exposed to earthquake
shaking. Still older paleoearthquakes, which took place
before any human reporting can be identified through,
e.g., tsunami deposits, sand intrusions, fallen stalagmites,
and other co-called seismites (Goldfinger, 2011). If dated,
the area, which was affected by the same earthquake, can
be used to estimate its size. However, mostly, only major
and great earthquakes can be detected in these ways. If
several paleoearthquakes were identified and dated, e.g.,
through isotopic methods, in the same area, recurrence
intervals can be estimated (e.g., Cisternas et al., 2005).
In order to describe the size of an earthquake in a physically more meaningful way, modern magnitudes are calculated from instrumental measurements of either the
Earthquakes, Table 1 Modified Mercalli intensity scale (After
Stein and Wysession, 2003; Turcotte and Schubert, 2014)
I
Usually not felt at all
II
Just a few people felt the earthquake, mainly on upper floors
of buildings
III Lamps and similar objects swing, vibrations like from a
passing truck
IV Glasses in a cupboard and windows clink, felt by many
indoors
V
Felt by nearly everyone with people sleeping mostly always
waking up
VI Glassware and windows break, felt by all
VII People have difficulties to stand upright, minor damage
VIII Branches break from trees and many buildings partially
collapse
IX Most people panic, cracks occur in the ground, solid buildings
partially collapse
X
Landslides occur, large buildings fall completely, rails bend
XI Few buildings remain standing, bridges destroyed
XII Complete damage, objects thrown in the air
EARTHQUAKES
213