

biogeochemistry, our knowledge of the impact of dust
deposition on the biogeochemistry of different areas of
the ocean is still fragmented (de Leeuw et al., 2014). Dust
dissolution experiments have shown the potential of dust
to release nutrients such as phosphorus (e.g., Ridame
and Guieu, 2002) and iron (e.g., Baker and Croot, 2010).
Large dust deposition events may also be a sink for
dissolved iron in the surface ocean via scavenging processes occurring during the sinking of the particles. The
importance of this scavenging depends on the ironbinding capacity of seawater where the deposition occurs
(Wagener et al., 2010). The impact on biota varies and
depends on the trophic status of the regions affected by
the deposition. In high-nutrient low-chlorophyll (HNLC)
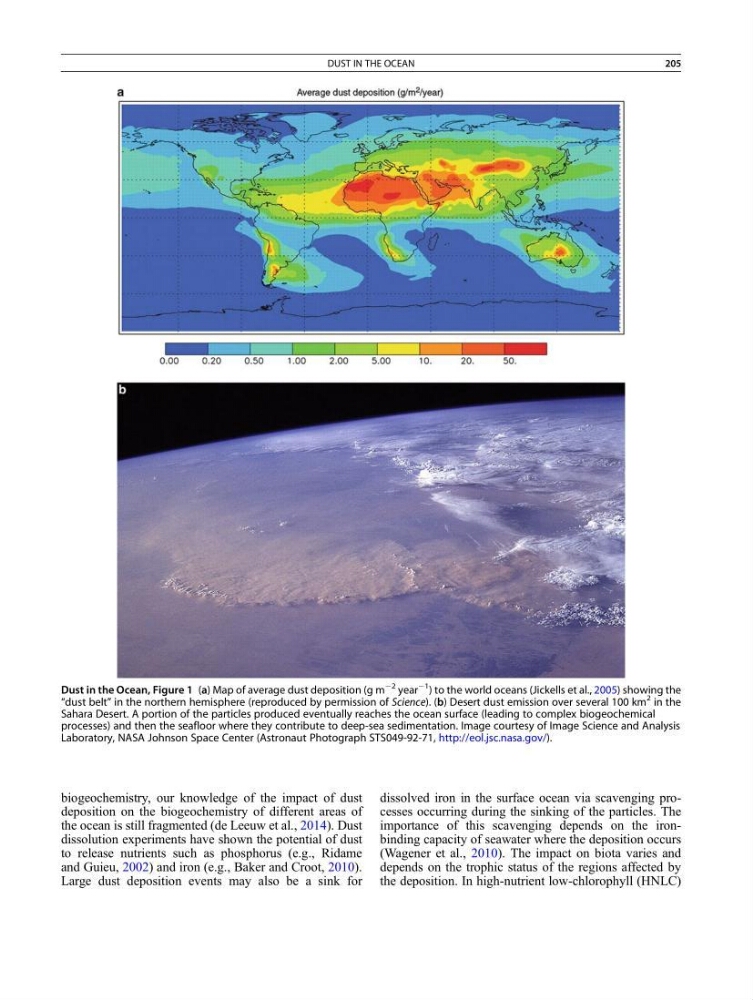
Dust in the Ocean, Figure 1 (a) Map of average dust deposition (g m
À2 year
À1 ) to the world oceans (Jickells et al., 2005) showing the
“dust belt” in the northern hemisphere (reproduced by permission of Science). (b) Desert dust emission over several 100 km
2 in the
Sahara Desert. A portion of the particles produced eventually reaches the ocean surface (leading to complex biogeochemical
processes) and then the seafloor where they contribute to deep-sea sedimentation. Image courtesy of Image Science and Analysis
Laboratory, NASA Johnson Space Center (Astronaut Photograph STS049-92-71, http://eol.jsc.nasa.gov/).
DUST IN THE OCEAN
205
deposition on the biogeochemistry of different areas of
the ocean is still fragmented (de Leeuw et al., 2014). Dust
dissolution experiments have shown the potential of dust
to release nutrients such as phosphorus (e.g., Ridame
and Guieu, 2002) and iron (e.g., Baker and Croot, 2010).
Large dust deposition events may also be a sink for
dissolved iron in the surface ocean via scavenging processes occurring during the sinking of the particles. The
importance of this scavenging depends on the ironbinding capacity of seawater where the deposition occurs
(Wagener et al., 2010). The impact on biota varies and
depends on the trophic status of the regions affected by
the deposition. In high-nutrient low-chlorophyll (HNLC)
Dust in the Ocean, Figure 1 (a) Map of average dust deposition (g m
À2 year
À1 ) to the world oceans (Jickells et al., 2005) showing the
“dust belt” in the northern hemisphere (reproduced by permission of Science). (b) Desert dust emission over several 100 km
2 in the
Sahara Desert. A portion of the particles produced eventually reaches the ocean surface (leading to complex biogeochemical
processes) and then the seafloor where they contribute to deep-sea sedimentation. Image courtesy of Image Science and Analysis
Laboratory, NASA Johnson Space Center (Astronaut Photograph STS049-92-71, http://eol.jsc.nasa.gov/).
DUST IN THE OCEAN
205