

U1335
5°10'
5°20'
5°30'N
126°20'W
126°10'
126°00'
17100
−4 40 0
4 4 0 0
4 4 0 0
44 00
4 4 0 0
4 4 0 0
4
4
0
0
430 0
4 3 0 0
4 3 0 0
41 00
Line 1
Line 3
Line 7
Line 2
Line 8
Line 4
Line 5
Line 6
10 km
15500
0
0
6
5
1
0
0
7
5
1
0 0 9 5 1
0
0
0
6
1
1 6 1
0 0
1 6 2 0 0
1 6 3 0 0
1 6 4 0 0
16500
16 60 0
16 70 0
0 0 8 6 1
0
0
9
6
1
0
0
0
7
1
0
0
2
7
1
17300
17400
17500
17600
17700
17800
17900
18000
18100
18200
18300
18400
18500
0
0
6
8
1
18700
18800
18900
1900 0
19100
19200
19300
19400
19500
19600
0 0 8 5 1
19100
U1335
4.4
4.2
4.0
Depth (km)
5.4
5.6
5.8
6.0
6.2
6.4
Two Way Travel Time (s)
distance along Line 1 (km)
26
24
22
20
18
16
14
12
10
8
6
4
2
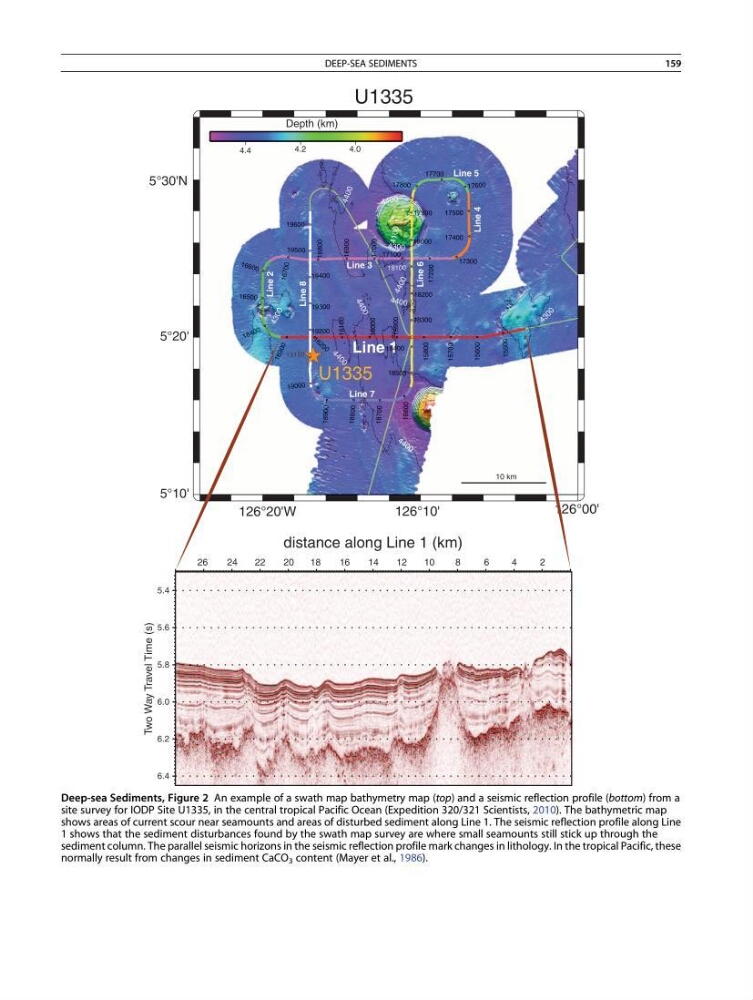
Deep-sea Sediments, Figure 2 An example of a swath map bathymetry map (top) and a seismic reflection profile (bottom) from a
site survey for IODP Site U1335, in the central tropical Pacific Ocean (Expedition 320/321 Scientists, 2010). The bathymetric map
shows areas of current scour near seamounts and areas of disturbed sediment along Line 1. The seismic reflection profile along Line
1 shows that the sediment disturbances found by the swath map survey are where small seamounts still stick up through the
sediment column. The parallel seismic horizons in the seismic reflection profile mark changes in lithology. In the tropical Pacific, these
normally result from changes in sediment CaCO 3 content (Mayer et al., 1986).
DEEP-SEA SEDIMENTS
159
5°10'
5°20'
5°30'N
126°20'W
126°10'
126°00'
17100
−4 40 0
4 4 0 0
4 4 0 0
44 00
4 4 0 0
4 4 0 0
4
4
0
0
430 0
4 3 0 0
4 3 0 0
41 00
Line 1
Line 3
Line 7
Line 2
Line 8
Line 4
Line 5
Line 6
10 km
15500
0
0
6
5
1
0
0
7
5
1
0 0 9 5 1
0
0
0
6
1
1 6 1
0 0
1 6 2 0 0
1 6 3 0 0
1 6 4 0 0
16500
16 60 0
16 70 0
0 0 8 6 1
0
0
9
6
1
0
0
0
7
1
0
0
2
7
1
17300
17400
17500
17600
17700
17800
17900
18000
18100
18200
18300
18400
18500
0
0
6
8
1
18700
18800
18900
1900 0
19100
19200
19300
19400
19500
19600
0 0 8 5 1
19100
U1335
4.4
4.2
4.0
Depth (km)
5.4
5.6
5.8
6.0
6.2
6.4
Two Way Travel Time (s)
distance along Line 1 (km)
26
24
22
20
18
16
14
12
10
8
6
4
2
Deep-sea Sediments, Figure 2 An example of a swath map bathymetry map (top) and a seismic reflection profile (bottom) from a
site survey for IODP Site U1335, in the central tropical Pacific Ocean (Expedition 320/321 Scientists, 2010). The bathymetric map
shows areas of current scour near seamounts and areas of disturbed sediment along Line 1. The seismic reflection profile along Line
1 shows that the sediment disturbances found by the swath map survey are where small seamounts still stick up through the
sediment column. The parallel seismic horizons in the seismic reflection profile mark changes in lithology. In the tropical Pacific, these
normally result from changes in sediment CaCO 3 content (Mayer et al., 1986).
DEEP-SEA SEDIMENTS
159