

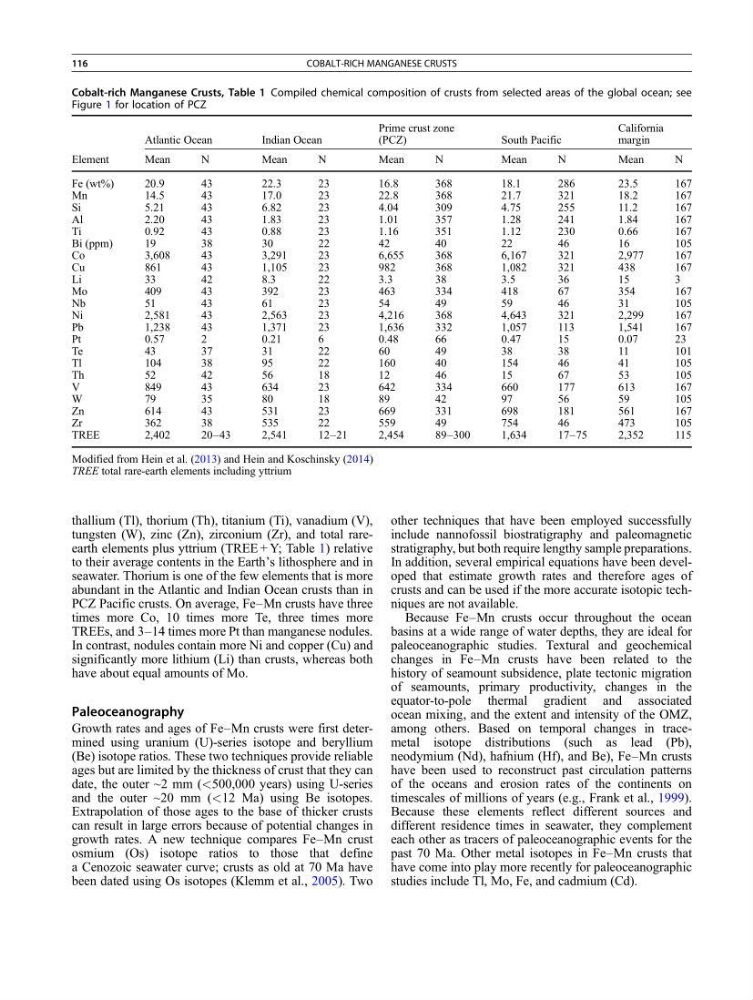
thallium (Tl), thorium (Th), titanium (Ti), vanadium (V),
tungsten (W), zinc (Zn), zirconium (Zr), and total rareearth elements plus yttrium (TREE + Y; Table 1) relative
to their average contents in the Earth’s lithosphere and in
seawater. Thorium is one of the few elements that is more
abundant in the Atlantic and Indian Ocean crusts than in
PCZ Pacific crusts. On average, Fe–Mn crusts have three
times more Co, 10 times more Te, three times more
TREEs, and 3–14 times more Pt than manganese nodules.
In contrast, nodules contain more Ni and copper (Cu) and
significantly more lithium (Li) than crusts, whereas both
have about equal amounts of Mo.
Paleoceanography
Growth rates and ages of Fe–Mn crusts were first determined using uranium (U)-series isotope and beryllium
(Be) isotope ratios. These two techniques provide reliable
ages but are limited by the thickness of crust that they can
date, the outer ~2 mm (<500,000 years) using U-series
and the outer ~20 mm (<12 Ma) using Be isotopes.
Extrapolation of those ages to the base of thicker crusts
can result in large errors because of potential changes in
growth rates. A new technique compares Fe–Mn crust
osmium (Os) isotope ratios to those that define
a Cenozoic seawater curve; crusts as old at 70 Ma have
been dated using Os isotopes (Klemm et al., 2005). Two
other techniques that have been employed successfully
include nannofossil biostratigraphy and paleomagnetic
stratigraphy, but both require lengthy sample preparations.
In addition, several empirical equations have been developed that estimate growth rates and therefore ages of
crusts and can be used if the more accurate isotopic techniques are not available.
Because Fe–Mn crusts occur throughout the ocean
basins at a wide range of water depths, they are ideal for
paleoceanographic studies. Textural and geochemical
changes in Fe–Mn crusts have been related to the
history of seamount subsidence, plate tectonic migration
of seamounts, primary productivity, changes in the
equator-to-pole thermal gradient and associated
ocean mixing, and the extent and intensity of the OMZ,
among others. Based on temporal changes in tracemetal isotope distributions (such as lead (Pb),
neodymium (Nd), hafnium (Hf), and Be), Fe–Mn crusts
have been used to reconstruct past circulation patterns
of the oceans and erosion rates of the continents on
timescales of millions of years (e.g., Frank et al., 1999).
Because these elements reflect different sources and
different residence times in seawater, they complement
each other as tracers of paleoceanographic events for the
past 70 Ma. Other metal isotopes in Fe–Mn crusts that
have come into play more recently for paleoceanographic
studies include Tl, Mo, Fe, and cadmium (Cd).
Cobalt-rich Manganese Crusts, Table 1 Compiled chemical composition of crusts from selected areas of the global ocean; see
Figure 1 for location of PCZ
Atlantic Ocean
Indian Ocean
Prime crust zone
(PCZ)
South Pacific
California
margin
Element
Mean
N
Mean
N
Mean
N
Mean
N
Mean
N
Fe (wt%)
20.9
43
22.3
23
16.8
368
18.1
286
23.5
167
Mn
14.5
43
17.0
23
22.8
368
21.7
321
18.2
167
Si
5.21
43
6.82
23
4.04
309
4.75
255
11.2
167
Al
2.20
43
1.83
23
1.01
357
1.28
241
1.84
167
Ti
0.92
43
0.88
23
1.16
351
1.12
230
0.66
167
Bi (ppm)
19
38
30
22
42
40
22
46
16
105
Co
3,608
43
3,291
23
6,655
368
6,167
321
2,977
167
Cu
861
43
1,105
23
982
368
1,082
321
438
167
Li
33
42
8.3
22
3.3
38
3.5
36
15
3
Mo
409
43
392
23
463
334
418
67
354
167
Nb
51
43
61
23
54
49
59
46
31
105
Ni
2,581
43
2,563
23
4,216
368
4,643
321
2,299
167
Pb
1,238
43
1,371
23
1,636
332
1,057
113
1,541
167
Pt
0.57
2
0.21
6
0.48
66
0.47
15
0.07
23
Te
43
37
31
22
60
49
38
38
11
101
Tl
104
38
95
22
160
40
154
46
41
105
Th
52
42
56
18
12
46
15
67
53
105
V
849
43
634
23
642
334
660
177
613
167
W
7 9
3 5
8 0
1 8
8 9
4 2
9 7
5 6
5 9
1 0 5
Zn
614
43
531
23
669
331
698
181
561
167
Zr
362
38
535
22
559
49
754
46
473
105
TREE
2,402
20–43
2,541
12–21
2,454
89–300
1,634
17–75
2,352
115
Modified from Hein et al. (2013) and Hein and Koschinsky (2014)
TREE total rare-earth elements including yttrium
116
COBALT-RICH MANGANESE CRUSTS
tungsten (W), zinc (Zn), zirconium (Zr), and total rareearth elements plus yttrium (TREE + Y; Table 1) relative
to their average contents in the Earth’s lithosphere and in
seawater. Thorium is one of the few elements that is more
abundant in the Atlantic and Indian Ocean crusts than in
PCZ Pacific crusts. On average, Fe–Mn crusts have three
times more Co, 10 times more Te, three times more
TREEs, and 3–14 times more Pt than manganese nodules.
In contrast, nodules contain more Ni and copper (Cu) and
significantly more lithium (Li) than crusts, whereas both
have about equal amounts of Mo.
Paleoceanography
Growth rates and ages of Fe–Mn crusts were first determined using uranium (U)-series isotope and beryllium
(Be) isotope ratios. These two techniques provide reliable
ages but are limited by the thickness of crust that they can
date, the outer ~2 mm (<500,000 years) using U-series
and the outer ~20 mm (<12 Ma) using Be isotopes.
Extrapolation of those ages to the base of thicker crusts
can result in large errors because of potential changes in
growth rates. A new technique compares Fe–Mn crust
osmium (Os) isotope ratios to those that define
a Cenozoic seawater curve; crusts as old at 70 Ma have
been dated using Os isotopes (Klemm et al., 2005). Two
other techniques that have been employed successfully
include nannofossil biostratigraphy and paleomagnetic
stratigraphy, but both require lengthy sample preparations.
In addition, several empirical equations have been developed that estimate growth rates and therefore ages of
crusts and can be used if the more accurate isotopic techniques are not available.
Because Fe–Mn crusts occur throughout the ocean
basins at a wide range of water depths, they are ideal for
paleoceanographic studies. Textural and geochemical
changes in Fe–Mn crusts have been related to the
history of seamount subsidence, plate tectonic migration
of seamounts, primary productivity, changes in the
equator-to-pole thermal gradient and associated
ocean mixing, and the extent and intensity of the OMZ,
among others. Based on temporal changes in tracemetal isotope distributions (such as lead (Pb),
neodymium (Nd), hafnium (Hf), and Be), Fe–Mn crusts
have been used to reconstruct past circulation patterns
of the oceans and erosion rates of the continents on
timescales of millions of years (e.g., Frank et al., 1999).
Because these elements reflect different sources and
different residence times in seawater, they complement
each other as tracers of paleoceanographic events for the
past 70 Ma. Other metal isotopes in Fe–Mn crusts that
have come into play more recently for paleoceanographic
studies include Tl, Mo, Fe, and cadmium (Cd).
Cobalt-rich Manganese Crusts, Table 1 Compiled chemical composition of crusts from selected areas of the global ocean; see
Figure 1 for location of PCZ
Atlantic Ocean
Indian Ocean
Prime crust zone
(PCZ)
South Pacific
California
margin
Element
Mean
N
Mean
N
Mean
N
Mean
N
Mean
N
Fe (wt%)
20.9
43
22.3
23
16.8
368
18.1
286
23.5
167
Mn
14.5
43
17.0
23
22.8
368
21.7
321
18.2
167
Si
5.21
43
6.82
23
4.04
309
4.75
255
11.2
167
Al
2.20
43
1.83
23
1.01
357
1.28
241
1.84
167
Ti
0.92
43
0.88
23
1.16
351
1.12
230
0.66
167
Bi (ppm)
19
38
30
22
42
40
22
46
16
105
Co
3,608
43
3,291
23
6,655
368
6,167
321
2,977
167
Cu
861
43
1,105
23
982
368
1,082
321
438
167
Li
33
42
8.3
22
3.3
38
3.5
36
15
3
Mo
409
43
392
23
463
334
418
67
354
167
Nb
51
43
61
23
54
49
59
46
31
105
Ni
2,581
43
2,563
23
4,216
368
4,643
321
2,299
167
Pb
1,238
43
1,371
23
1,636
332
1,057
113
1,541
167
Pt
0.57
2
0.21
6
0.48
66
0.47
15
0.07
23
Te
43
37
31
22
60
49
38
38
11
101
Tl
104
38
95
22
160
40
154
46
41
105
Th
52
42
56
18
12
46
15
67
53
105
V
849
43
634
23
642
334
660
177
613
167
W
7 9
3 5
8 0
1 8
8 9
4 2
9 7
5 6
5 9
1 0 5
Zn
614
43
531
23
669
331
698
181
561
167
Zr
362
38
535
22
559
49
754
46
473
105
TREE
2,402
20–43
2,541
12–21
2,454
89–300
1,634
17–75
2,352
115
Modified from Hein et al. (2013) and Hein and Koschinsky (2014)
TREE total rare-earth elements including yttrium
116
COBALT-RICH MANGANESE CRUSTS