

III. Sediment Transport
............................
109
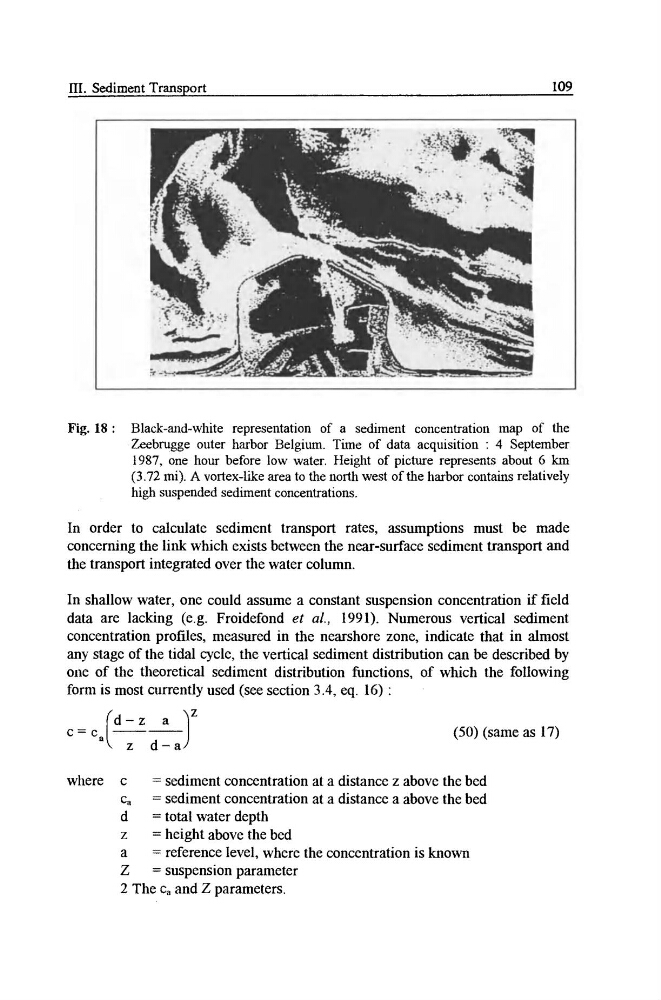
Fig. 18 : Black-and-white representation of a sediment concentration map of the
Zeebrugge outer harbor Belgium. Time of data acquisition : 4 September
t 987, one hour before low water. Height of picture represents about 6 km
(3.72 mi). A vortex-like area to the north west of the harbor contains relatively
high suspended sediment concentrations.
In order to calculate sediment transport rates, assumptions must be made
concerning the link which exists between the near-surface sediment transport and
the transport integrated over the water column.
In shallow water, one could assume a constant suspension concentration if field
data are lacking (e.g. Froidefond et al., 1991). Numerous vertical sediment
concentration profiles, measured in the nearshore zone, indicate that in almost
any stage of the tidal cycle, the vertical sediment distribution can be described by
one of the theoretical sediment distribution functions, of which the following
form is most currently used (see section 3.4, eq. 16) :
c = c a " z d - ~
(50) (same as 17)
where c
= sediment concentration at a distance z above the bed
c~ = sediment concentration at a distance a above the bed
d
= total water depth
z
= height above the bed
a
= reference level, where the concentration is known
Z
= suspension parameter
2 The c, and Z parameters.
............................
109
Fig. 18 : Black-and-white representation of a sediment concentration map of the
Zeebrugge outer harbor Belgium. Time of data acquisition : 4 September
t 987, one hour before low water. Height of picture represents about 6 km
(3.72 mi). A vortex-like area to the north west of the harbor contains relatively
high suspended sediment concentrations.
In order to calculate sediment transport rates, assumptions must be made
concerning the link which exists between the near-surface sediment transport and
the transport integrated over the water column.
In shallow water, one could assume a constant suspension concentration if field
data are lacking (e.g. Froidefond et al., 1991). Numerous vertical sediment
concentration profiles, measured in the nearshore zone, indicate that in almost
any stage of the tidal cycle, the vertical sediment distribution can be described by
one of the theoretical sediment distribution functions, of which the following
form is most currently used (see section 3.4, eq. 16) :
c = c a " z d - ~
(50) (same as 17)
where c
= sediment concentration at a distance z above the bed
c~ = sediment concentration at a distance a above the bed
d
= total water depth
z
= height above the bed
a
= reference level, where the concentration is known
Z
= suspension parameter
2 The c, and Z parameters.