

394
J. Murawski and J. Woge Nielsen
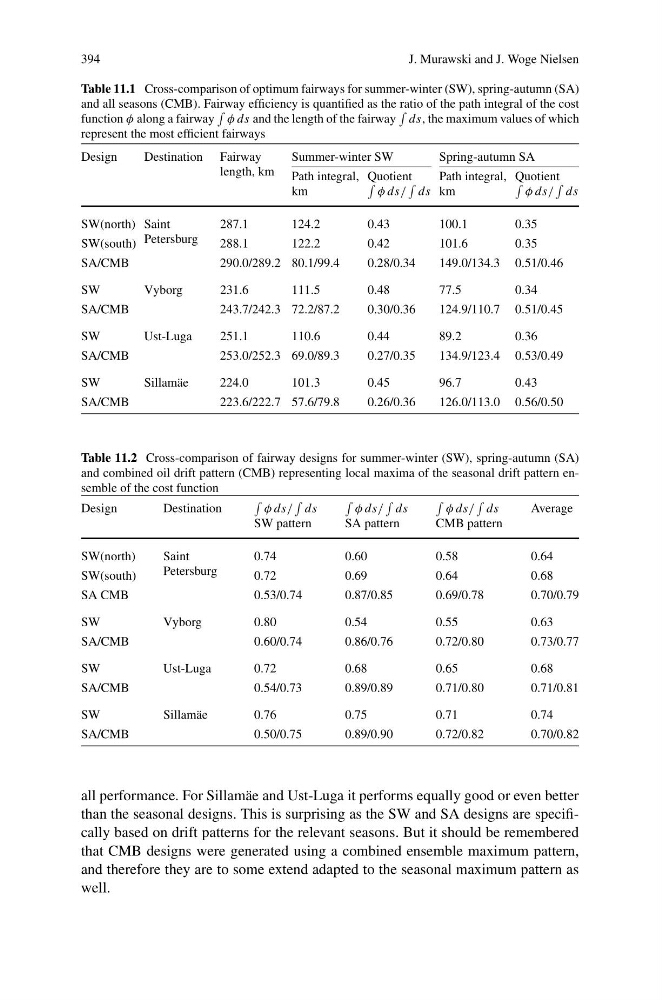
Table 11.1 Cross-comparison of optimum fairways for summer-winter (SW), spring-autumn (SA)
and all seasons (CMB). Fairway efficiency is quantified as the ratio of the path integral of the cost
function φ along a fairway
φ ds and the length of the fairway
ds, the maximum values of which
represent the most efficient fairways
Design
Destination Fairway
length, km
Summer-winter SW
Spring-autumn SA
Path integral,
km
Quotient
φ ds/
ds
Path integral,
km
Quotient
φ ds/
ds
SW(north) Saint
Petersburg
287.1
124.2
0.43
100.1
0.35
SW(south)
288.1
122.2
0.42
101.6
0.35
SA/CMB
290.0/289.2 80.1/99.4
0.28/0.34
149.0/134.3 0.51/0.46
SW
Vyborg
231.6
111.5
0.48
77.5
0.34
SA/CMB
243.7/242.3 72.2/87.2
0.30/0.36
124.9/110.7 0.51/0.45
SW
Ust-Luga
251.1
110.6
0.44
89.2
0.36
SA/CMB
253.0/252.3 69.0/89.3
0.27/0.35
134.9/123.4 0.53/0.49
SW
Sillamäe
224.0
101.3
0.45
96.7
0.43
SA/CMB
223.6/222.7 57.6/79.8
0.26/0.36
126.0/113.0 0.56/0.50
Table 11.2 Cross-comparison of fairway designs for summer-winter (SW), spring-autumn (SA)
and combined oil drift pattern (CMB) representing local maxima of the seasonal drift pattern ensemble of the cost function
Design
Destination
φ ds/
ds
SW pattern
φ ds/
ds
SA pattern
φ ds/
ds
CMB pattern
Average
SW(north)
Saint
Petersburg
0.74
0.60
0.58
0.64
SW(south)
0.72
0.69
0.64
0.68
SA CMB
0.53/0.74
0.87/0.85
0.69/0.78
0.70/0.79
SW
Vyborg
0.80
0.54
0.55
0.63
SA/CMB
0.60/0.74
0.86/0.76
0.72/0.80
0.73/0.77
SW
Ust-Luga
0.72
0.68
0.65
0.68
SA/CMB
0.54/0.73
0.89/0.89
0.71/0.80
0.71/0.81
SW
Sillamäe
0.76
0.75
0.71
0.74
SA/CMB
0.50/0.75
0.89/0.90
0.72/0.82
0.70/0.82
all performance. For Sillamäe and Ust-Luga it performs equally good or even better
than the seasonal designs. This is surprising as the SW and SA designs are specifically based on drift patterns for the relevant seasons. But it should be remembered
that CMB designs were generated using a combined ensemble maximum pattern,
and therefore they are to some extend adapted to the seasonal maximum pattern as
well.
J. Murawski and J. Woge Nielsen
Table 11.1 Cross-comparison of optimum fairways for summer-winter (SW), spring-autumn (SA)
and all seasons (CMB). Fairway efficiency is quantified as the ratio of the path integral of the cost
function φ along a fairway
φ ds and the length of the fairway
ds, the maximum values of which
represent the most efficient fairways
Design
Destination Fairway
length, km
Summer-winter SW
Spring-autumn SA
Path integral,
km
Quotient
φ ds/
ds
Path integral,
km
Quotient
φ ds/
ds
SW(north) Saint
Petersburg
287.1
124.2
0.43
100.1
0.35
SW(south)
288.1
122.2
0.42
101.6
0.35
SA/CMB
290.0/289.2 80.1/99.4
0.28/0.34
149.0/134.3 0.51/0.46
SW
Vyborg
231.6
111.5
0.48
77.5
0.34
SA/CMB
243.7/242.3 72.2/87.2
0.30/0.36
124.9/110.7 0.51/0.45
SW
Ust-Luga
251.1
110.6
0.44
89.2
0.36
SA/CMB
253.0/252.3 69.0/89.3
0.27/0.35
134.9/123.4 0.53/0.49
SW
Sillamäe
224.0
101.3
0.45
96.7
0.43
SA/CMB
223.6/222.7 57.6/79.8
0.26/0.36
126.0/113.0 0.56/0.50
Table 11.2 Cross-comparison of fairway designs for summer-winter (SW), spring-autumn (SA)
and combined oil drift pattern (CMB) representing local maxima of the seasonal drift pattern ensemble of the cost function
Design
Destination
φ ds/
ds
SW pattern
φ ds/
ds
SA pattern
φ ds/
ds
CMB pattern
Average
SW(north)
Saint
Petersburg
0.74
0.60
0.58
0.64
SW(south)
0.72
0.69
0.64
0.68
SA CMB
0.53/0.74
0.87/0.85
0.69/0.78
0.70/0.79
SW
Vyborg
0.80
0.54
0.55
0.63
SA/CMB
0.60/0.74
0.86/0.76
0.72/0.80
0.73/0.77
SW
Ust-Luga
0.72
0.68
0.65
0.68
SA/CMB
0.54/0.73
0.89/0.89
0.71/0.80
0.71/0.81
SW
Sillamäe
0.76
0.75
0.71
0.74
SA/CMB
0.50/0.75
0.89/0.90
0.72/0.82
0.70/0.82
all performance. For Sillamäe and Ust-Luga it performs equally good or even better
than the seasonal designs. This is surprising as the SW and SA designs are specifically based on drift patterns for the relevant seasons. But it should be remembered
that CMB designs were generated using a combined ensemble maximum pattern,
and therefore they are to some extend adapted to the seasonal maximum pattern as
well.