

348
T. Soomere
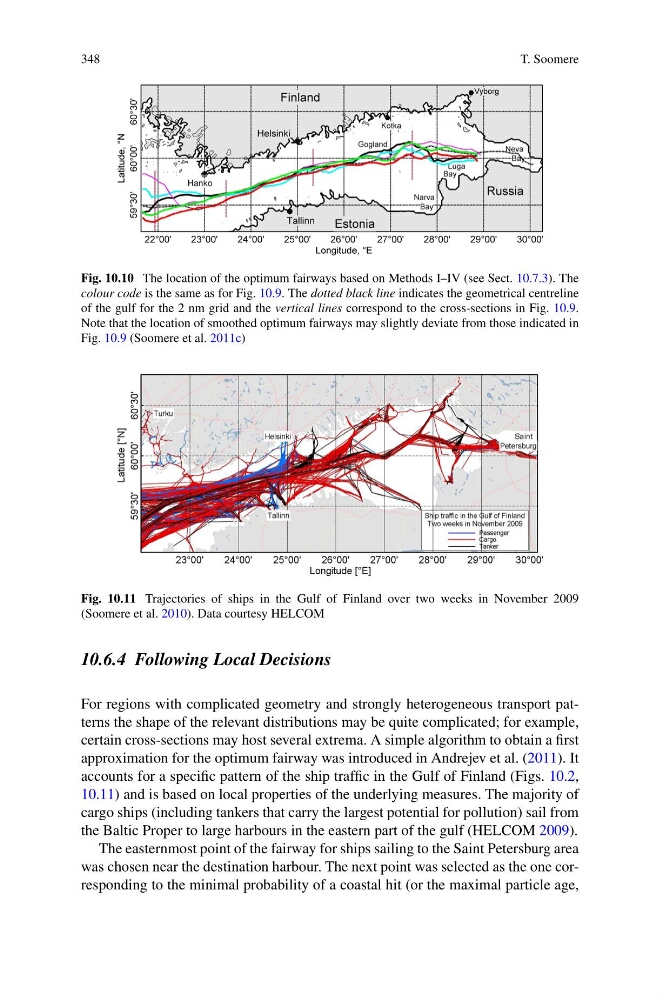
Fig. 10.10 The location of the optimum fairways based on Methods I–IV (see Sect. 10.7.3). The
colour code is the same as for Fig. 10.9. The dotted black line indicates the geometrical centreline
of the gulf for the 2 nm grid and the vertical lines correspond to the cross-sections in Fig. 10.9.
Note that the location of smoothed optimum fairways may slightly deviate from those indicated in
Fig. 10.9 (Soomere et al. 2011c)
Fig. 10.11 Trajectories of ships in the Gulf of Finland over two weeks in November 2009
(Soomere et al. 2010). Data courtesy HELCOM
10.6.4 Following Local Decisions
For regions with complicated geometry and strongly heterogeneous transport patterns the shape of the relevant distributions may be quite complicated; for example,
certain cross-sections may host several extrema. A simple algorithm to obtain a first
approximation for the optimum fairway was introduced in Andrejev et al. (2011). It
accounts for a specific pattern of the ship traffic in the Gulf of Finland (Figs. 10.2,
10.11) and is based on local properties of the underlying measures. The majority of
cargo ships (including tankers that carry the largest potential for pollution) sail from
the Baltic Proper to large harbours in the eastern part of the gulf (HELCOM 2009).
The easternmost point of the fairway for ships sailing to the Saint Petersburg area
was chosen near the destination harbour. The next point was selected as the one corresponding to the minimal probability of a coastal hit (or the maximal particle age,
T. Soomere
Fig. 10.10 The location of the optimum fairways based on Methods I–IV (see Sect. 10.7.3). The
colour code is the same as for Fig. 10.9. The dotted black line indicates the geometrical centreline
of the gulf for the 2 nm grid and the vertical lines correspond to the cross-sections in Fig. 10.9.
Note that the location of smoothed optimum fairways may slightly deviate from those indicated in
Fig. 10.9 (Soomere et al. 2011c)
Fig. 10.11 Trajectories of ships in the Gulf of Finland over two weeks in November 2009
(Soomere et al. 2010). Data courtesy HELCOM
10.6.4 Following Local Decisions
For regions with complicated geometry and strongly heterogeneous transport patterns the shape of the relevant distributions may be quite complicated; for example,
certain cross-sections may host several extrema. A simple algorithm to obtain a first
approximation for the optimum fairway was introduced in Andrejev et al. (2011). It
accounts for a specific pattern of the ship traffic in the Gulf of Finland (Figs. 10.2,
10.11) and is based on local properties of the underlying measures. The majority of
cargo ships (including tankers that carry the largest potential for pollution) sail from
the Baltic Proper to large harbours in the eastern part of the gulf (HELCOM 2009).
The easternmost point of the fairway for ships sailing to the Saint Petersburg area
was chosen near the destination harbour. The next point was selected as the one corresponding to the minimal probability of a coastal hit (or the maximal particle age,