

10 Applications of the Inverse Problem of Pollution Propagation
335
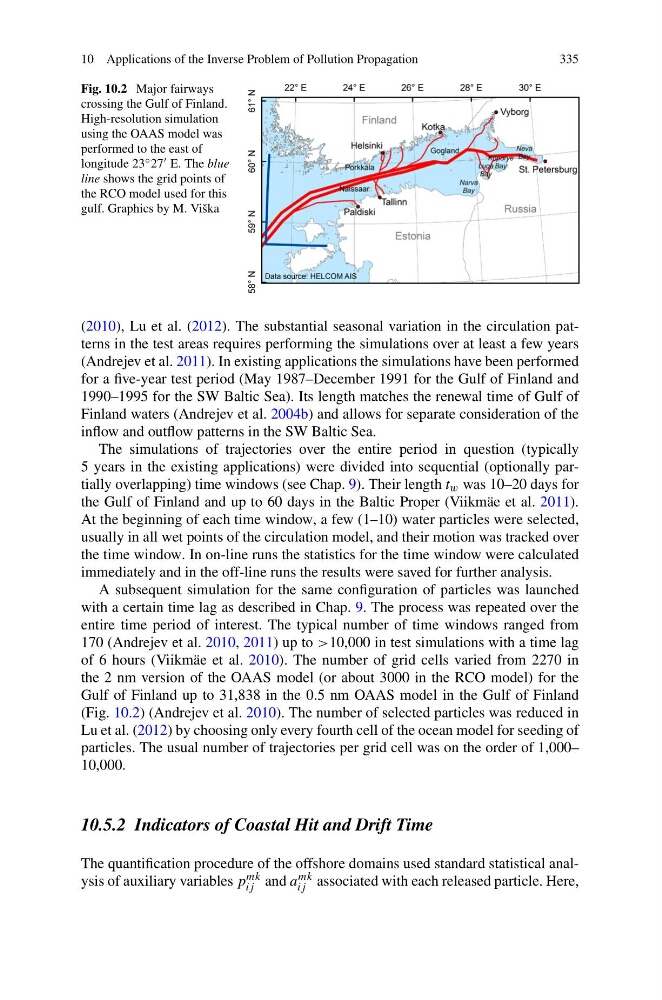
Fig. 10.2 Major fairways
crossing the Gulf of Finland.
High-resolution simulation
using the OAAS model was
performed to the east of
longitude 23 ◦ 27 E. The blue
line shows the grid points of
the RCO model used for this
gulf. Graphics by M. Viška
(2010), Lu et al. (2012). The substantial seasonal variation in the circulation patterns in the test areas requires performing the simulations over at least a few years
(Andrejev et al. 2011). In existing applications the simulations have been performed
for a five-year test period (May 1987–December 1991 for the Gulf of Finland and
1990–1995 for the SW Baltic Sea). Its length matches the renewal time of Gulf of
Finland waters (Andrejev et al. 2004b) and allows for separate consideration of the
inflow and outflow patterns in the SW Baltic Sea.
The simulations of trajectories over the entire period in question (typically
5 years in the existing applications) were divided into sequential (optionally partially overlapping) time windows (see Chap. 9). Their length t w was 10–20 days for
the Gulf of Finland and up to 60 days in the Baltic Proper (Viikmäe et al. 2011).
At the beginning of each time window, a few (1–10) water particles were selected,
usually in all wet points of the circulation model, and their motion was tracked over
the time window. In on-line runs the statistics for the time window were calculated
immediately and in the off-line runs the results were saved for further analysis.
A subsequent simulation for the same configuration of particles was launched
with a certain time lag as described in Chap. 9. The process was repeated over the
entire time period of interest. The typical number of time windows ranged from
170 (Andrejev et al. 2010, 2011) up to >10,000 in test simulations with a time lag
of 6 hours (Viikmäe et al. 2010). The number of grid cells varied from 2270 in
the 2 nm version of the OAAS model (or about 3000 in the RCO model) for the
Gulf of Finland up to 31,838 in the 0.5 nm OAAS model in the Gulf of Finland
(Fig. 10.2) (Andrejev et al. 2010). The number of selected particles was reduced in
Lu et al. (2012) by choosing only every fourth cell of the ocean model for seeding of
particles. The usual number of trajectories per grid cell was on the order of 1,000–
10,000.
10.5.2 Indicators of Coastal Hit and Drift Time
The quantification procedure of the offshore domains used standard statistical analysis of auxiliary variables p mk
ij and a mk
ij associated with each released particle. Here,
335
Fig. 10.2 Major fairways
crossing the Gulf of Finland.
High-resolution simulation
using the OAAS model was
performed to the east of
longitude 23 ◦ 27 E. The blue
line shows the grid points of
the RCO model used for this
gulf. Graphics by M. Viška
(2010), Lu et al. (2012). The substantial seasonal variation in the circulation patterns in the test areas requires performing the simulations over at least a few years
(Andrejev et al. 2011). In existing applications the simulations have been performed
for a five-year test period (May 1987–December 1991 for the Gulf of Finland and
1990–1995 for the SW Baltic Sea). Its length matches the renewal time of Gulf of
Finland waters (Andrejev et al. 2004b) and allows for separate consideration of the
inflow and outflow patterns in the SW Baltic Sea.
The simulations of trajectories over the entire period in question (typically
5 years in the existing applications) were divided into sequential (optionally partially overlapping) time windows (see Chap. 9). Their length t w was 10–20 days for
the Gulf of Finland and up to 60 days in the Baltic Proper (Viikmäe et al. 2011).
At the beginning of each time window, a few (1–10) water particles were selected,
usually in all wet points of the circulation model, and their motion was tracked over
the time window. In on-line runs the statistics for the time window were calculated
immediately and in the off-line runs the results were saved for further analysis.
A subsequent simulation for the same configuration of particles was launched
with a certain time lag as described in Chap. 9. The process was repeated over the
entire time period of interest. The typical number of time windows ranged from
170 (Andrejev et al. 2010, 2011) up to >10,000 in test simulations with a time lag
of 6 hours (Viikmäe et al. 2010). The number of grid cells varied from 2270 in
the 2 nm version of the OAAS model (or about 3000 in the RCO model) for the
Gulf of Finland up to 31,838 in the 0.5 nm OAAS model in the Gulf of Finland
(Fig. 10.2) (Andrejev et al. 2010). The number of selected particles was reduced in
Lu et al. (2012) by choosing only every fourth cell of the ocean model for seeding of
particles. The usual number of trajectories per grid cell was on the order of 1,000–
10,000.
10.5.2 Indicators of Coastal Hit and Drift Time
The quantification procedure of the offshore domains used standard statistical analysis of auxiliary variables p mk
ij and a mk
ij associated with each released particle. Here,