

308
T. Soomere
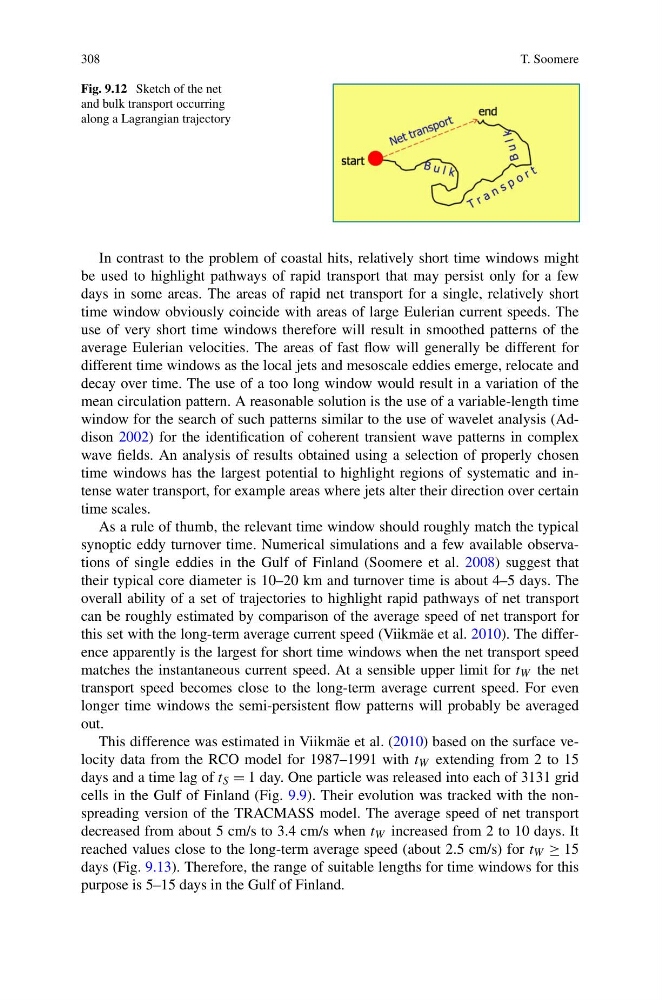
Fig. 9.12 Sketch of the net
and bulk transport occurring
along a Lagrangian trajectory
In contrast to the problem of coastal hits, relatively short time windows might
be used to highlight pathways of rapid transport that may persist only for a few
days in some areas. The areas of rapid net transport for a single, relatively short
time window obviously coincide with areas of large Eulerian current speeds. The
use of very short time windows therefore will result in smoothed patterns of the
average Eulerian velocities. The areas of fast flow will generally be different for
different time windows as the local jets and mesoscale eddies emerge, relocate and
decay over time. The use of a too long window would result in a variation of the
mean circulation pattern. A reasonable solution is the use of a variable-length time
window for the search of such patterns similar to the use of wavelet analysis (Addison 2002) for the identification of coherent transient wave patterns in complex
wave fields. An analysis of results obtained using a selection of properly chosen
time windows has the largest potential to highlight regions of systematic and intense water transport, for example areas where jets alter their direction over certain
time scales.
As a rule of thumb, the relevant time window should roughly match the typical
synoptic eddy turnover time. Numerical simulations and a few available observations of single eddies in the Gulf of Finland (Soomere et al. 2008) suggest that
their typical core diameter is 10–20 km and turnover time is about 4–5 days. The
overall ability of a set of trajectories to highlight rapid pathways of net transport
can be roughly estimated by comparison of the average speed of net transport for
this set with the long-term average current speed (Viikmäe et al. 2010). The difference apparently is the largest for short time windows when the net transport speed
matches the instantaneous current speed. At a sensible upper limit for t W the net
transport speed becomes close to the long-term average current speed. For even
longer time windows the semi-persistent flow patterns will probably be averaged
out.
This difference was estimated in Viikmäe et al. (2010) based on the surface velocity data from the RCO model for 1987–1991 with t W extending from 2 to 15
days and a time lag of t S = 1 day. One particle was released into each of 3131 grid
cells in the Gulf of Finland (Fig. 9.9). Their evolution was tracked with the nonspreading version of the TRACMASS model. The average speed of net transport
decreased from about 5 cm/s to 3.4 cm/s when t W increased from 2 to 10 days. It
reached values close to the long-term average speed (about 2.5 cm/s) for t W ≥ 15
days (Fig. 9.13). Therefore, the range of suitable lengths for time windows for this
purpose is 5–15 days in the Gulf of Finland.
T. Soomere
Fig. 9.12 Sketch of the net
and bulk transport occurring
along a Lagrangian trajectory
In contrast to the problem of coastal hits, relatively short time windows might
be used to highlight pathways of rapid transport that may persist only for a few
days in some areas. The areas of rapid net transport for a single, relatively short
time window obviously coincide with areas of large Eulerian current speeds. The
use of very short time windows therefore will result in smoothed patterns of the
average Eulerian velocities. The areas of fast flow will generally be different for
different time windows as the local jets and mesoscale eddies emerge, relocate and
decay over time. The use of a too long window would result in a variation of the
mean circulation pattern. A reasonable solution is the use of a variable-length time
window for the search of such patterns similar to the use of wavelet analysis (Addison 2002) for the identification of coherent transient wave patterns in complex
wave fields. An analysis of results obtained using a selection of properly chosen
time windows has the largest potential to highlight regions of systematic and intense water transport, for example areas where jets alter their direction over certain
time scales.
As a rule of thumb, the relevant time window should roughly match the typical
synoptic eddy turnover time. Numerical simulations and a few available observations of single eddies in the Gulf of Finland (Soomere et al. 2008) suggest that
their typical core diameter is 10–20 km and turnover time is about 4–5 days. The
overall ability of a set of trajectories to highlight rapid pathways of net transport
can be roughly estimated by comparison of the average speed of net transport for
this set with the long-term average current speed (Viikmäe et al. 2010). The difference apparently is the largest for short time windows when the net transport speed
matches the instantaneous current speed. At a sensible upper limit for t W the net
transport speed becomes close to the long-term average current speed. For even
longer time windows the semi-persistent flow patterns will probably be averaged
out.
This difference was estimated in Viikmäe et al. (2010) based on the surface velocity data from the RCO model for 1987–1991 with t W extending from 2 to 15
days and a time lag of t S = 1 day. One particle was released into each of 3131 grid
cells in the Gulf of Finland (Fig. 9.9). Their evolution was tracked with the nonspreading version of the TRACMASS model. The average speed of net transport
decreased from about 5 cm/s to 3.4 cm/s when t W increased from 2 to 10 days. It
reached values close to the long-term average speed (about 2.5 cm/s) for t W ≥ 15
days (Fig. 9.13). Therefore, the range of suitable lengths for time windows for this
purpose is 5–15 days in the Gulf of Finland.