

9 Statistics of Lagrangian Transport Reveals Hidden Features of Velocity Fields
303
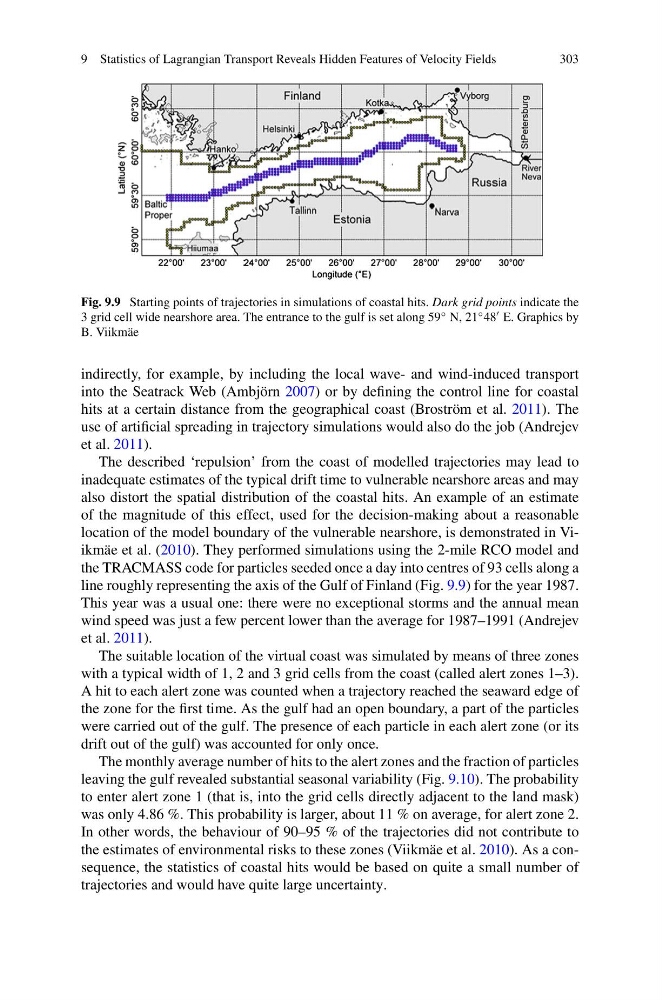
Fig. 9.9 Starting points of trajectories in simulations of coastal hits. Dark grid points indicate the
3 grid cell wide nearshore area. The entrance to the gulf is set along 59 ◦ N, 21 ◦ 48 E. Graphics by
B. Viikmäe
indirectly, for example, by including the local wave- and wind-induced transport
into the Seatrack Web (Ambjörn 2007) or by defining the control line for coastal
hits at a certain distance from the geographical coast (Broström et al. 2011). The
use of artificial spreading in trajectory simulations would also do the job (Andrejev
et al. 2011).
The described ‘repulsion’ from the coast of modelled trajectories may lead to
inadequate estimates of the typical drift time to vulnerable nearshore areas and may
also distort the spatial distribution of the coastal hits. An example of an estimate
of the magnitude of this effect, used for the decision-making about a reasonable
location of the model boundary of the vulnerable nearshore, is demonstrated in Viikmäe et al. (2010). They performed simulations using the 2-mile RCO model and
the TRACMASS code for particles seeded once a day into centres of 93 cells along a
line roughly representing the axis of the Gulf of Finland (Fig. 9.9) for the year 1987.
This year was a usual one: there were no exceptional storms and the annual mean
wind speed was just a few percent lower than the average for 1987–1991 (Andrejev
et al. 2011).
The suitable location of the virtual coast was simulated by means of three zones
with a typical width of 1, 2 and 3 grid cells from the coast (called alert zones 1–3).
A hit to each alert zone was counted when a trajectory reached the seaward edge of
the zone for the first time. As the gulf had an open boundary, a part of the particles
were carried out of the gulf. The presence of each particle in each alert zone (or its
drift out of the gulf) was accounted for only once.
The monthly average number of hits to the alert zones and the fraction of particles
leaving the gulf revealed substantial seasonal variability (Fig. 9.10). The probability
to enter alert zone 1 (that is, into the grid cells directly adjacent to the land mask)
was only 4.86 %. This probability is larger, about 11 % on average, for alert zone 2.
In other words, the behaviour of 90–95 % of the trajectories did not contribute to
the estimates of environmental risks to these zones (Viikmäe et al. 2010). As a consequence, the statistics of coastal hits would be based on quite a small number of
trajectories and would have quite large uncertainty.
303
Fig. 9.9 Starting points of trajectories in simulations of coastal hits. Dark grid points indicate the
3 grid cell wide nearshore area. The entrance to the gulf is set along 59 ◦ N, 21 ◦ 48 E. Graphics by
B. Viikmäe
indirectly, for example, by including the local wave- and wind-induced transport
into the Seatrack Web (Ambjörn 2007) or by defining the control line for coastal
hits at a certain distance from the geographical coast (Broström et al. 2011). The
use of artificial spreading in trajectory simulations would also do the job (Andrejev
et al. 2011).
The described ‘repulsion’ from the coast of modelled trajectories may lead to
inadequate estimates of the typical drift time to vulnerable nearshore areas and may
also distort the spatial distribution of the coastal hits. An example of an estimate
of the magnitude of this effect, used for the decision-making about a reasonable
location of the model boundary of the vulnerable nearshore, is demonstrated in Viikmäe et al. (2010). They performed simulations using the 2-mile RCO model and
the TRACMASS code for particles seeded once a day into centres of 93 cells along a
line roughly representing the axis of the Gulf of Finland (Fig. 9.9) for the year 1987.
This year was a usual one: there were no exceptional storms and the annual mean
wind speed was just a few percent lower than the average for 1987–1991 (Andrejev
et al. 2011).
The suitable location of the virtual coast was simulated by means of three zones
with a typical width of 1, 2 and 3 grid cells from the coast (called alert zones 1–3).
A hit to each alert zone was counted when a trajectory reached the seaward edge of
the zone for the first time. As the gulf had an open boundary, a part of the particles
were carried out of the gulf. The presence of each particle in each alert zone (or its
drift out of the gulf) was accounted for only once.
The monthly average number of hits to the alert zones and the fraction of particles
leaving the gulf revealed substantial seasonal variability (Fig. 9.10). The probability
to enter alert zone 1 (that is, into the grid cells directly adjacent to the land mask)
was only 4.86 %. This probability is larger, about 11 % on average, for alert zone 2.
In other words, the behaviour of 90–95 % of the trajectories did not contribute to
the estimates of environmental risks to these zones (Viikmäe et al. 2010). As a consequence, the statistics of coastal hits would be based on quite a small number of
trajectories and would have quite large uncertainty.