

274
J. Kjellsson et al.
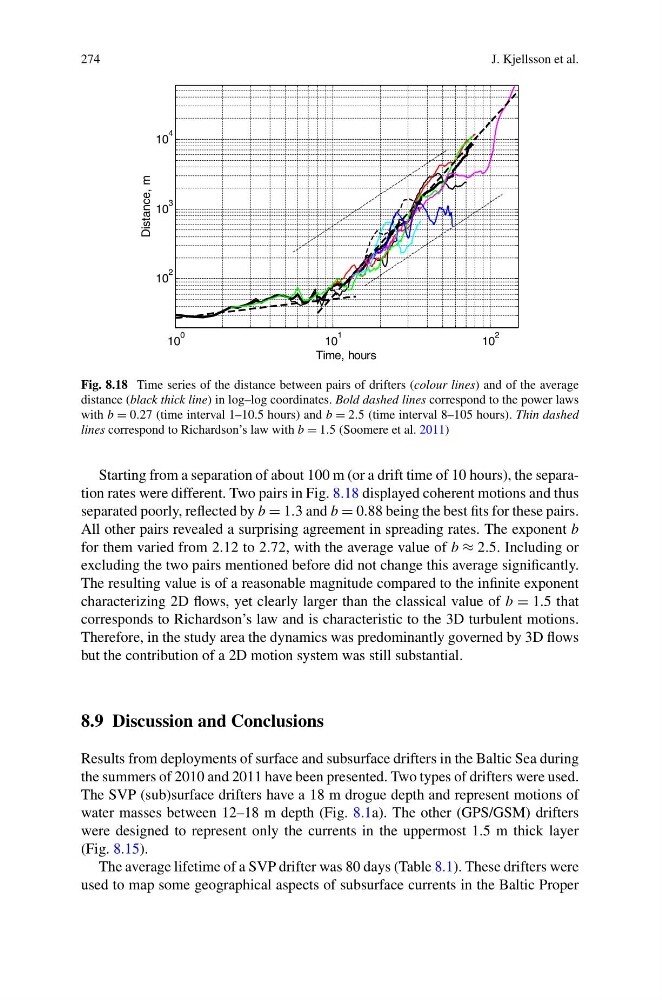
Fig. 8.18 Time series of the distance between pairs of drifters (colour lines) and of the average
distance (black thick line) in log–log coordinates. Bold dashed lines correspond to the power laws
with b = 0.27 (time interval 1–10.5 hours) and b = 2.5 (time interval 8–105 hours). Thin dashed
lines correspond to Richardson’s law with b = 1.5 (Soomere et al. 2011)
Starting from a separation of about 100 m (or a drift time of 10 hours), the separation rates were different. Two pairs in Fig. 8.18 displayed coherent motions and thus
separated poorly, reflected by b = 1.3 and b = 0.88 being the best fits for these pairs.
All other pairs revealed a surprising agreement in spreading rates. The exponent b
for them varied from 2.12 to 2.72, with the average value of b ≈ 2.5. Including or
excluding the two pairs mentioned before did not change this average significantly.
The resulting value is of a reasonable magnitude compared to the infinite exponent
characterizing 2D flows, yet clearly larger than the classical value of b = 1.5 that
corresponds to Richardson’s law and is characteristic to the 3D turbulent motions.
Therefore, in the study area the dynamics was predominantly governed by 3D flows
but the contribution of a 2D motion system was still substantial.
8.9 Discussion and Conclusions
Results from deployments of surface and subsurface drifters in the Baltic Sea during
the summers of 2010 and 2011 have been presented. Two types of drifters were used.
The SVP (sub)surface drifters have a 18 m drogue depth and represent motions of
water masses between 12–18 m depth (Fig. 8.1a). The other (GPS/GSM) drifters
were designed to represent only the currents in the uppermost 1.5 m thick layer
(Fig. 8.15).
The average lifetime of a SVP drifter was 80 days (Table 8.1). These drifters were
used to map some geographical aspects of subsurface currents in the Baltic Proper
J. Kjellsson et al.
Fig. 8.18 Time series of the distance between pairs of drifters (colour lines) and of the average
distance (black thick line) in log–log coordinates. Bold dashed lines correspond to the power laws
with b = 0.27 (time interval 1–10.5 hours) and b = 2.5 (time interval 8–105 hours). Thin dashed
lines correspond to Richardson’s law with b = 1.5 (Soomere et al. 2011)
Starting from a separation of about 100 m (or a drift time of 10 hours), the separation rates were different. Two pairs in Fig. 8.18 displayed coherent motions and thus
separated poorly, reflected by b = 1.3 and b = 0.88 being the best fits for these pairs.
All other pairs revealed a surprising agreement in spreading rates. The exponent b
for them varied from 2.12 to 2.72, with the average value of b ≈ 2.5. Including or
excluding the two pairs mentioned before did not change this average significantly.
The resulting value is of a reasonable magnitude compared to the infinite exponent
characterizing 2D flows, yet clearly larger than the classical value of b = 1.5 that
corresponds to Richardson’s law and is characteristic to the 3D turbulent motions.
Therefore, in the study area the dynamics was predominantly governed by 3D flows
but the contribution of a 2D motion system was still substantial.
8.9 Discussion and Conclusions
Results from deployments of surface and subsurface drifters in the Baltic Sea during
the summers of 2010 and 2011 have been presented. Two types of drifters were used.
The SVP (sub)surface drifters have a 18 m drogue depth and represent motions of
water masses between 12–18 m depth (Fig. 8.1a). The other (GPS/GSM) drifters
were designed to represent only the currents in the uppermost 1.5 m thick layer
(Fig. 8.15).
The average lifetime of a SVP drifter was 80 days (Table 8.1). These drifters were
used to map some geographical aspects of subsurface currents in the Baltic Proper