

262
J. Kjellsson et al.
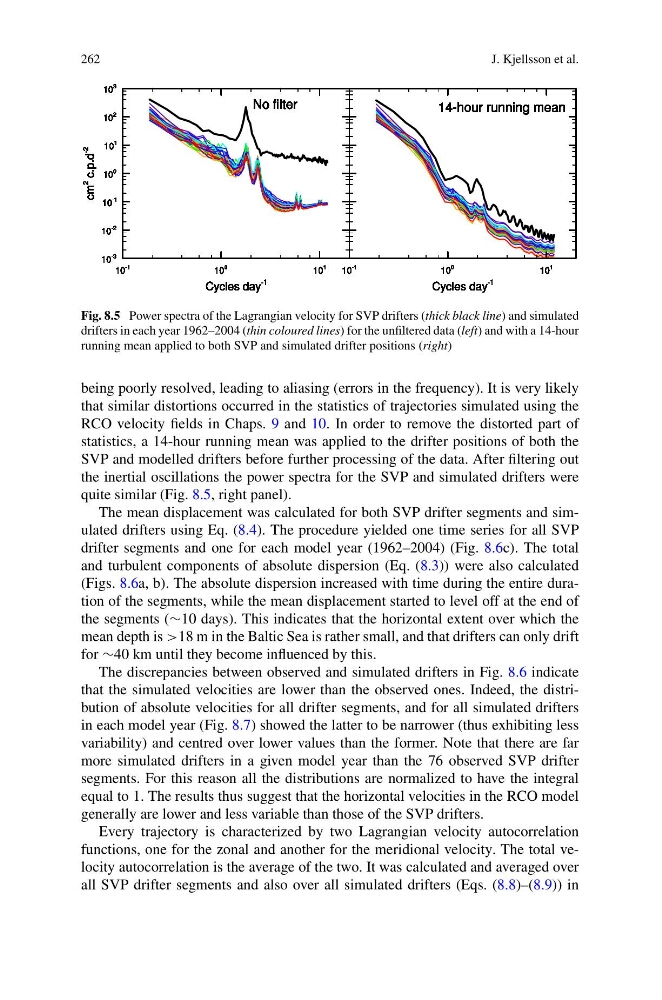
Fig. 8.5 Power spectra of the Lagrangian velocity for SVP drifters (thick black line) and simulated
drifters in each year 1962–2004 (thin coloured lines) for the unfiltered data (left) and with a 14-hour
running mean applied to both SVP and simulated drifter positions (right)
being poorly resolved, leading to aliasing (errors in the frequency). It is very likely
that similar distortions occurred in the statistics of trajectories simulated using the
RCO velocity fields in Chaps. 9 and 10. In order to remove the distorted part of
statistics, a 14-hour running mean was applied to the drifter positions of both the
SVP and modelled drifters before further processing of the data. After filtering out
the inertial oscillations the power spectra for the SVP and simulated drifters were
quite similar (Fig. 8.5, right panel).
The mean displacement was calculated for both SVP drifter segments and simulated drifters using Eq. (8.4). The procedure yielded one time series for all SVP
drifter segments and one for each model year (1962–2004) (Fig. 8.6c). The total
and turbulent components of absolute dispersion (Eq. (8.3)) were also calculated
(Figs. 8.6a, b). The absolute dispersion increased with time during the entire duration of the segments, while the mean displacement started to level off at the end of
the segments (∼10 days). This indicates that the horizontal extent over which the
mean depth is >18 m in the Baltic Sea is rather small, and that drifters can only drift
for ∼40 km until they become influenced by this.
The discrepancies between observed and simulated drifters in Fig. 8.6 indicate
that the simulated velocities are lower than the observed ones. Indeed, the distribution of absolute velocities for all drifter segments, and for all simulated drifters
in each model year (Fig. 8.7) showed the latter to be narrower (thus exhibiting less
variability) and centred over lower values than the former. Note that there are far
more simulated drifters in a given model year than the 76 observed SVP drifter
segments. For this reason all the distributions are normalized to have the integral
equal to 1. The results thus suggest that the horizontal velocities in the RCO model
generally are lower and less variable than those of the SVP drifters.
Every trajectory is characterized by two Lagrangian velocity autocorrelation
functions, one for the zonal and another for the meridional velocity. The total velocity autocorrelation is the average of the two. It was calculated and averaged over
all SVP drifter segments and also over all simulated drifters (Eqs. (8.8)–(8.9)) in
J. Kjellsson et al.
Fig. 8.5 Power spectra of the Lagrangian velocity for SVP drifters (thick black line) and simulated
drifters in each year 1962–2004 (thin coloured lines) for the unfiltered data (left) and with a 14-hour
running mean applied to both SVP and simulated drifter positions (right)
being poorly resolved, leading to aliasing (errors in the frequency). It is very likely
that similar distortions occurred in the statistics of trajectories simulated using the
RCO velocity fields in Chaps. 9 and 10. In order to remove the distorted part of
statistics, a 14-hour running mean was applied to the drifter positions of both the
SVP and modelled drifters before further processing of the data. After filtering out
the inertial oscillations the power spectra for the SVP and simulated drifters were
quite similar (Fig. 8.5, right panel).
The mean displacement was calculated for both SVP drifter segments and simulated drifters using Eq. (8.4). The procedure yielded one time series for all SVP
drifter segments and one for each model year (1962–2004) (Fig. 8.6c). The total
and turbulent components of absolute dispersion (Eq. (8.3)) were also calculated
(Figs. 8.6a, b). The absolute dispersion increased with time during the entire duration of the segments, while the mean displacement started to level off at the end of
the segments (∼10 days). This indicates that the horizontal extent over which the
mean depth is >18 m in the Baltic Sea is rather small, and that drifters can only drift
for ∼40 km until they become influenced by this.
The discrepancies between observed and simulated drifters in Fig. 8.6 indicate
that the simulated velocities are lower than the observed ones. Indeed, the distribution of absolute velocities for all drifter segments, and for all simulated drifters
in each model year (Fig. 8.7) showed the latter to be narrower (thus exhibiting less
variability) and centred over lower values than the former. Note that there are far
more simulated drifters in a given model year than the 76 observed SVP drifter
segments. For this reason all the distributions are normalized to have the integral
equal to 1. The results thus suggest that the horizontal velocities in the RCO model
generally are lower and less variable than those of the SVP drifters.
Every trajectory is characterized by two Lagrangian velocity autocorrelation
functions, one for the zonal and another for the meridional velocity. The total velocity autocorrelation is the average of the two. It was calculated and averaged over
all SVP drifter segments and also over all simulated drifters (Eqs. (8.8)–(8.9)) in