

190
K. Myrberg and T. Soomere
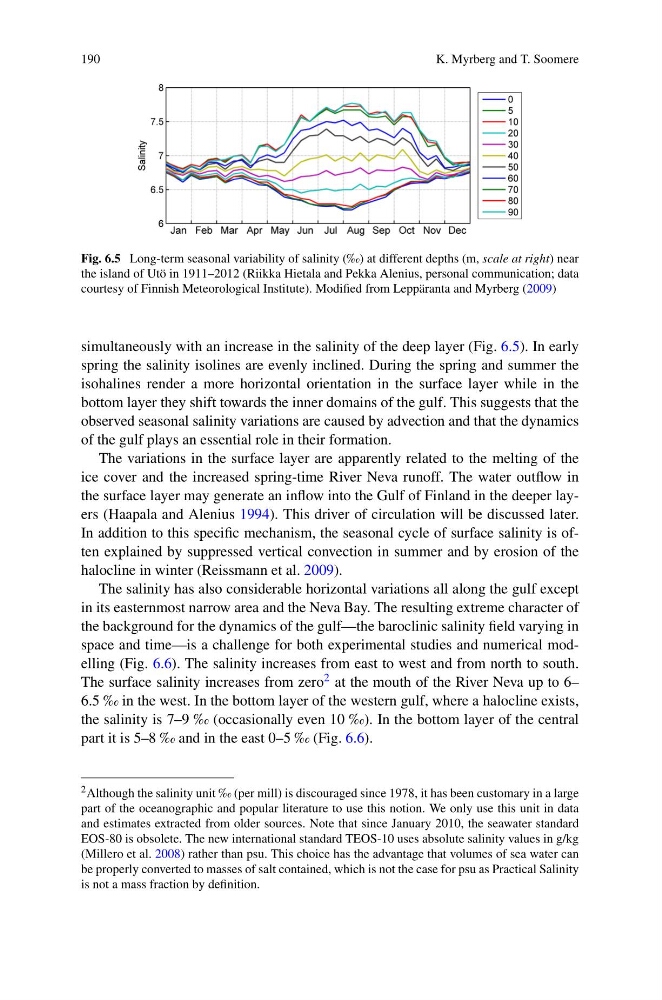
Fig. 6.5 Long-term seasonal variability of salinity (‰) at different depths (m, scale at right) near
the island of Utö in 1911–2012 (Riikka Hietala and Pekka Alenius, personal communication; data
courtesy of Finnish Meteorological Institute). Modified from Leppäranta and Myrberg (2009)
simultaneously with an increase in the salinity of the deep layer (Fig. 6.5). In early
spring the salinity isolines are evenly inclined. During the spring and summer the
isohalines render a more horizontal orientation in the surface layer while in the
bottom layer they shift towards the inner domains of the gulf. This suggests that the
observed seasonal salinity variations are caused by advection and that the dynamics
of the gulf plays an essential role in their formation.
The variations in the surface layer are apparently related to the melting of the
ice cover and the increased spring-time River Neva runoff. The water outflow in
the surface layer may generate an inflow into the Gulf of Finland in the deeper layers (Haapala and Alenius 1994). This driver of circulation will be discussed later.
In addition to this specific mechanism, the seasonal cycle of surface salinity is often explained by suppressed vertical convection in summer and by erosion of the
halocline in winter (Reissmann et al. 2009).
The salinity has also considerable horizontal variations all along the gulf except
in its easternmost narrow area and the Neva Bay. The resulting extreme character of
the background for the dynamics of the gulf—the baroclinic salinity field varying in
space and time—is a challenge for both experimental studies and numerical modelling (Fig. 6.6). The salinity increases from east to west and from north to south.
The surface salinity increases from zero 2 at the mouth of the River Neva up to 6–
6.5 ‰ in the west. In the bottom layer of the western gulf, where a halocline exists,
the salinity is 7–9 ‰ (occasionally even 10 ‰). In the bottom layer of the central
part it is 5–8 ‰ and in the east 0–5 ‰ (Fig. 6.6).
2 Although the salinity unit ‰ (per mill) is discouraged since 1978, it has been customary in a large
part of the oceanographic and popular literature to use this notion. We only use this unit in data
and estimates extracted from older sources. Note that since January 2010, the seawater standard
EOS-80 is obsolete. The new international standard TEOS-10 uses absolute salinity values in g/kg
(Millero et al. 2008) rather than psu. This choice has the advantage that volumes of sea water can
be properly converted to masses of salt contained, which is not the case for psu as Practical Salinity
is not a mass fraction by definition.
K. Myrberg and T. Soomere
Fig. 6.5 Long-term seasonal variability of salinity (‰) at different depths (m, scale at right) near
the island of Utö in 1911–2012 (Riikka Hietala and Pekka Alenius, personal communication; data
courtesy of Finnish Meteorological Institute). Modified from Leppäranta and Myrberg (2009)
simultaneously with an increase in the salinity of the deep layer (Fig. 6.5). In early
spring the salinity isolines are evenly inclined. During the spring and summer the
isohalines render a more horizontal orientation in the surface layer while in the
bottom layer they shift towards the inner domains of the gulf. This suggests that the
observed seasonal salinity variations are caused by advection and that the dynamics
of the gulf plays an essential role in their formation.
The variations in the surface layer are apparently related to the melting of the
ice cover and the increased spring-time River Neva runoff. The water outflow in
the surface layer may generate an inflow into the Gulf of Finland in the deeper layers (Haapala and Alenius 1994). This driver of circulation will be discussed later.
In addition to this specific mechanism, the seasonal cycle of surface salinity is often explained by suppressed vertical convection in summer and by erosion of the
halocline in winter (Reissmann et al. 2009).
The salinity has also considerable horizontal variations all along the gulf except
in its easternmost narrow area and the Neva Bay. The resulting extreme character of
the background for the dynamics of the gulf—the baroclinic salinity field varying in
space and time—is a challenge for both experimental studies and numerical modelling (Fig. 6.6). The salinity increases from east to west and from north to south.
The surface salinity increases from zero 2 at the mouth of the River Neva up to 6–
6.5 ‰ in the west. In the bottom layer of the western gulf, where a halocline exists,
the salinity is 7–9 ‰ (occasionally even 10 ‰). In the bottom layer of the central
part it is 5–8 ‰ and in the east 0–5 ‰ (Fig. 6.6).
2 Although the salinity unit ‰ (per mill) is discouraged since 1978, it has been customary in a large
part of the oceanographic and popular literature to use this notion. We only use this unit in data
and estimates extracted from older sources. Note that since January 2010, the seawater standard
EOS-80 is obsolete. The new international standard TEOS-10 uses absolute salinity values in g/kg
(Millero et al. 2008) rather than psu. This choice has the advantage that volumes of sea water can
be properly converted to masses of salt contained, which is not the case for psu as Practical Salinity
is not a mass fraction by definition.