

162
E.V. Stanev and X. Lu
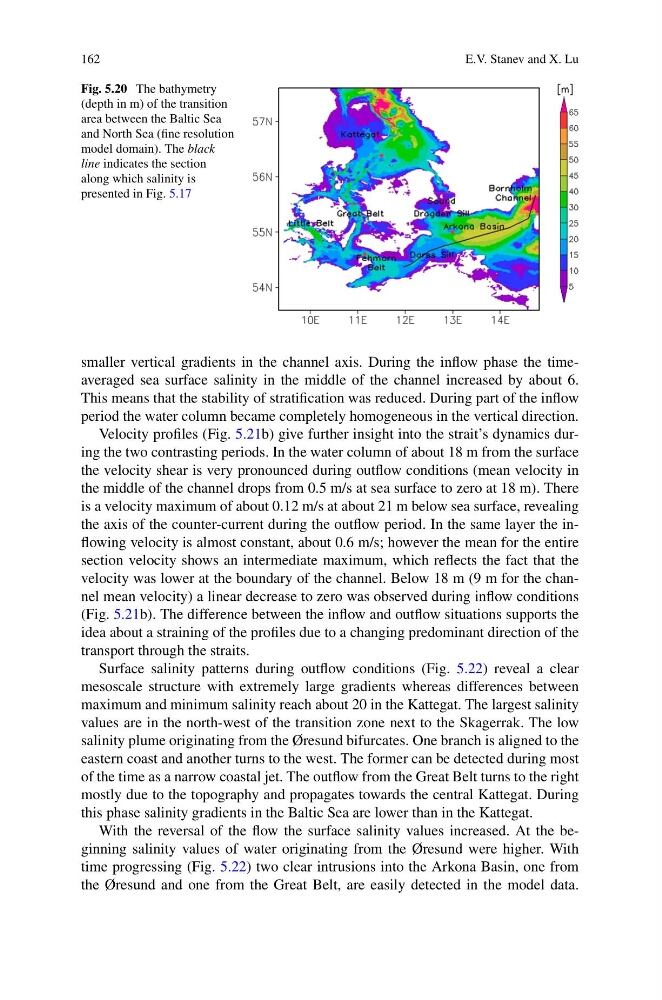
Fig. 5.20 The bathymetry
(depth in m) of the transition
area between the Baltic Sea
and North Sea (fine resolution
model domain). The black
line indicates the section
along which salinity is
presented in Fig. 5.17
smaller vertical gradients in the channel axis. During the inflow phase the timeaveraged sea surface salinity in the middle of the channel increased by about 6.
This means that the stability of stratification was reduced. During part of the inflow
period the water column became completely homogeneous in the vertical direction.
Velocity profiles (Fig. 5.21b) give further insight into the strait’s dynamics during the two contrasting periods. In the water column of about 18 m from the surface
the velocity shear is very pronounced during outflow conditions (mean velocity in
the middle of the channel drops from 0.5 m/s at sea surface to zero at 18 m). There
is a velocity maximum of about 0.12 m/s at about 21 m below sea surface, revealing
the axis of the counter-current during the outflow period. In the same layer the inflowing velocity is almost constant, about 0.6 m/s; however the mean for the entire
section velocity shows an intermediate maximum, which reflects the fact that the
velocity was lower at the boundary of the channel. Below 18 m (9 m for the channel mean velocity) a linear decrease to zero was observed during inflow conditions
(Fig. 5.21b). The difference between the inflow and outflow situations supports the
idea about a straining of the profiles due to a changing predominant direction of the
transport through the straits.
Surface salinity patterns during outflow conditions (Fig. 5.22) reveal a clear
mesoscale structure with extremely large gradients whereas differences between
maximum and minimum salinity reach about 20 in the Kattegat. The largest salinity
values are in the north-west of the transition zone next to the Skagerrak. The low
salinity plume originating from the Øresund bifurcates. One branch is aligned to the
eastern coast and another turns to the west. The former can be detected during most
of the time as a narrow coastal jet. The outflow from the Great Belt turns to the right
mostly due to the topography and propagates towards the central Kattegat. During
this phase salinity gradients in the Baltic Sea are lower than in the Kattegat.
With the reversal of the flow the surface salinity values increased. At the beginning salinity values of water originating from the Øresund were higher. With
time progressing (Fig. 5.22) two clear intrusions into the Arkona Basin, one from
the Øresund and one from the Great Belt, are easily detected in the model data.
E.V. Stanev and X. Lu
Fig. 5.20 The bathymetry
(depth in m) of the transition
area between the Baltic Sea
and North Sea (fine resolution
model domain). The black
line indicates the section
along which salinity is
presented in Fig. 5.17
smaller vertical gradients in the channel axis. During the inflow phase the timeaveraged sea surface salinity in the middle of the channel increased by about 6.
This means that the stability of stratification was reduced. During part of the inflow
period the water column became completely homogeneous in the vertical direction.
Velocity profiles (Fig. 5.21b) give further insight into the strait’s dynamics during the two contrasting periods. In the water column of about 18 m from the surface
the velocity shear is very pronounced during outflow conditions (mean velocity in
the middle of the channel drops from 0.5 m/s at sea surface to zero at 18 m). There
is a velocity maximum of about 0.12 m/s at about 21 m below sea surface, revealing
the axis of the counter-current during the outflow period. In the same layer the inflowing velocity is almost constant, about 0.6 m/s; however the mean for the entire
section velocity shows an intermediate maximum, which reflects the fact that the
velocity was lower at the boundary of the channel. Below 18 m (9 m for the channel mean velocity) a linear decrease to zero was observed during inflow conditions
(Fig. 5.21b). The difference between the inflow and outflow situations supports the
idea about a straining of the profiles due to a changing predominant direction of the
transport through the straits.
Surface salinity patterns during outflow conditions (Fig. 5.22) reveal a clear
mesoscale structure with extremely large gradients whereas differences between
maximum and minimum salinity reach about 20 in the Kattegat. The largest salinity
values are in the north-west of the transition zone next to the Skagerrak. The low
salinity plume originating from the Øresund bifurcates. One branch is aligned to the
eastern coast and another turns to the west. The former can be detected during most
of the time as a narrow coastal jet. The outflow from the Great Belt turns to the right
mostly due to the topography and propagates towards the central Kattegat. During
this phase salinity gradients in the Baltic Sea are lower than in the Kattegat.
With the reversal of the flow the surface salinity values increased. At the beginning salinity values of water originating from the Øresund were higher. With
time progressing (Fig. 5.22) two clear intrusions into the Arkona Basin, one from
the Øresund and one from the Great Belt, are easily detected in the model data.