

5 European Semi-enclosed Seas
137
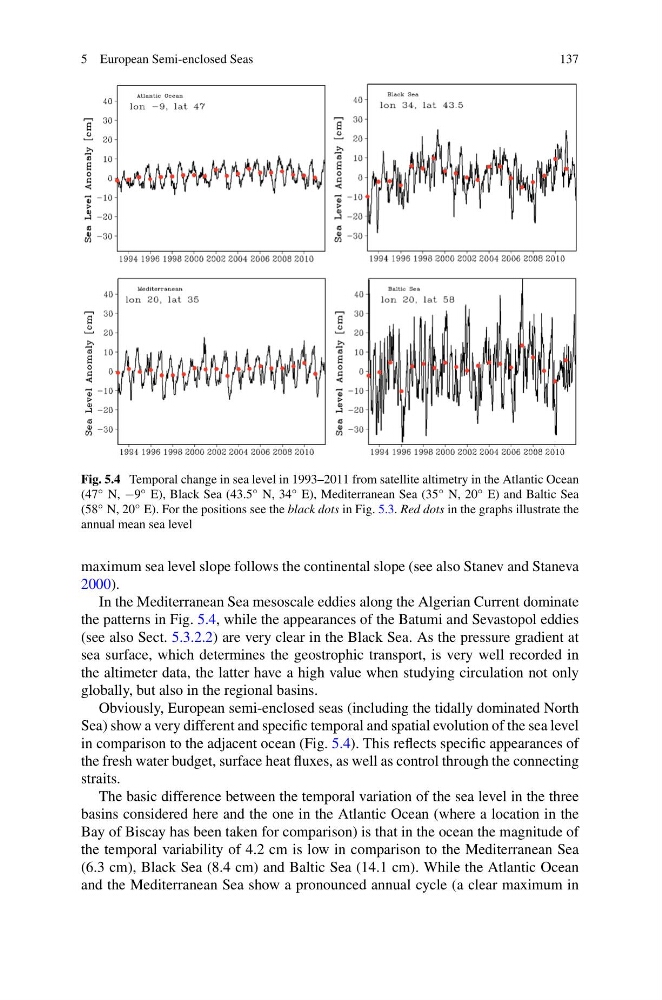
Fig. 5.4 Temporal change in sea level in 1993–2011 from satellite altimetry in the Atlantic Ocean
(47 ◦ N, −9 ◦ E), Black Sea (43.5 ◦ N, 34 ◦ E), Mediterranean Sea (35 ◦ N, 20 ◦ E) and Baltic Sea
(58 ◦ N, 20 ◦ E). For the positions see the black dots in Fig. 5.3. Red dots in the graphs illustrate the
annual mean sea level
maximum sea level slope follows the continental slope (see also Stanev and Staneva
2000).
In the Mediterranean Sea mesoscale eddies along the Algerian Current dominate
the patterns in Fig. 5.4, while the appearances of the Batumi and Sevastopol eddies
(see also Sect. 5.3.2.2) are very clear in the Black Sea. As the pressure gradient at
sea surface, which determines the geostrophic transport, is very well recorded in
the altimeter data, the latter have a high value when studying circulation not only
globally, but also in the regional basins.
Obviously, European semi-enclosed seas (including the tidally dominated North
Sea) show a very different and specific temporal and spatial evolution of the sea level
in comparison to the adjacent ocean (Fig. 5.4). This reflects specific appearances of
the fresh water budget, surface heat fluxes, as well as control through the connecting
straits.
The basic difference between the temporal variation of the sea level in the three
basins considered here and the one in the Atlantic Ocean (where a location in the
Bay of Biscay has been taken for comparison) is that in the ocean the magnitude of
the temporal variability of 4.2 cm is low in comparison to the Mediterranean Sea
(6.3 cm), Black Sea (8.4 cm) and Baltic Sea (14.1 cm). While the Atlantic Ocean
and the Mediterranean Sea show a pronounced annual cycle (a clear maximum in
137
Fig. 5.4 Temporal change in sea level in 1993–2011 from satellite altimetry in the Atlantic Ocean
(47 ◦ N, −9 ◦ E), Black Sea (43.5 ◦ N, 34 ◦ E), Mediterranean Sea (35 ◦ N, 20 ◦ E) and Baltic Sea
(58 ◦ N, 20 ◦ E). For the positions see the black dots in Fig. 5.3. Red dots in the graphs illustrate the
annual mean sea level
maximum sea level slope follows the continental slope (see also Stanev and Staneva
2000).
In the Mediterranean Sea mesoscale eddies along the Algerian Current dominate
the patterns in Fig. 5.4, while the appearances of the Batumi and Sevastopol eddies
(see also Sect. 5.3.2.2) are very clear in the Black Sea. As the pressure gradient at
sea surface, which determines the geostrophic transport, is very well recorded in
the altimeter data, the latter have a high value when studying circulation not only
globally, but also in the regional basins.
Obviously, European semi-enclosed seas (including the tidally dominated North
Sea) show a very different and specific temporal and spatial evolution of the sea level
in comparison to the adjacent ocean (Fig. 5.4). This reflects specific appearances of
the fresh water budget, surface heat fluxes, as well as control through the connecting
straits.
The basic difference between the temporal variation of the sea level in the three
basins considered here and the one in the Atlantic Ocean (where a location in the
Bay of Biscay has been taken for comparison) is that in the ocean the magnitude of
the temporal variability of 4.2 cm is low in comparison to the Mediterranean Sea
(6.3 cm), Black Sea (8.4 cm) and Baltic Sea (14.1 cm). While the Atlantic Ocean
and the Mediterranean Sea show a pronounced annual cycle (a clear maximum in