

122
H.E.M. Meier and A. Höglund
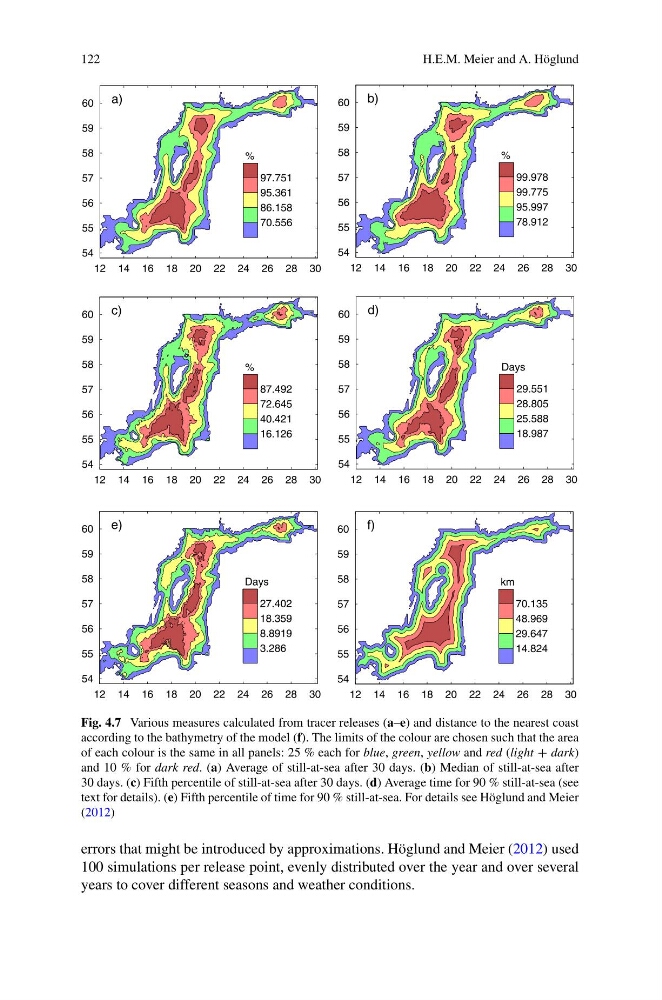
Fig. 4.7 Various measures calculated from tracer releases (a–e) and distance to the nearest coast
according to the bathymetry of the model (f). The limits of the colour are chosen such that the area
of each colour is the same in all panels: 25 % each for blue, green, yellow and red (light + dark)
and 10 % for dark red. (a) Average of still-at-sea after 30 days. (b) Median of still-at-sea after
30 days. (c) Fifth percentile of still-at-sea after 30 days. (d) Average time for 90 % still-at-sea (see
text for details). (e) Fifth percentile of time for 90 % still-at-sea. For details see Höglund and Meier
(2012)
errors that might be introduced by approximations. Höglund and Meier (2012) used
100 simulations per release point, evenly distributed over the year and over several
years to cover different seasons and weather conditions.
H.E.M. Meier and A. Höglund
Fig. 4.7 Various measures calculated from tracer releases (a–e) and distance to the nearest coast
according to the bathymetry of the model (f). The limits of the colour are chosen such that the area
of each colour is the same in all panels: 25 % each for blue, green, yellow and red (light + dark)
and 10 % for dark red. (a) Average of still-at-sea after 30 days. (b) Median of still-at-sea after
30 days. (c) Fifth percentile of still-at-sea after 30 days. (d) Average time for 90 % still-at-sea (see
text for details). (e) Fifth percentile of time for 90 % still-at-sea. For details see Höglund and Meier
(2012)
errors that might be introduced by approximations. Höglund and Meier (2012) used
100 simulations per release point, evenly distributed over the year and over several
years to cover different seasons and weather conditions.