

5. This section asked the respondent to provide demographic information, such as
gender, age, family status, etc. These answers enabled a regression analysis of
the data, which in turn allowed the researchers to test the results of the survey
against expected adherence to economic theory. The answers are also used to
compare the demographics of the sample with the demographics of the general
population of Israel.
17.4 Analysis of the CVM Survey Results
17.4.1 Descriptive Statistics
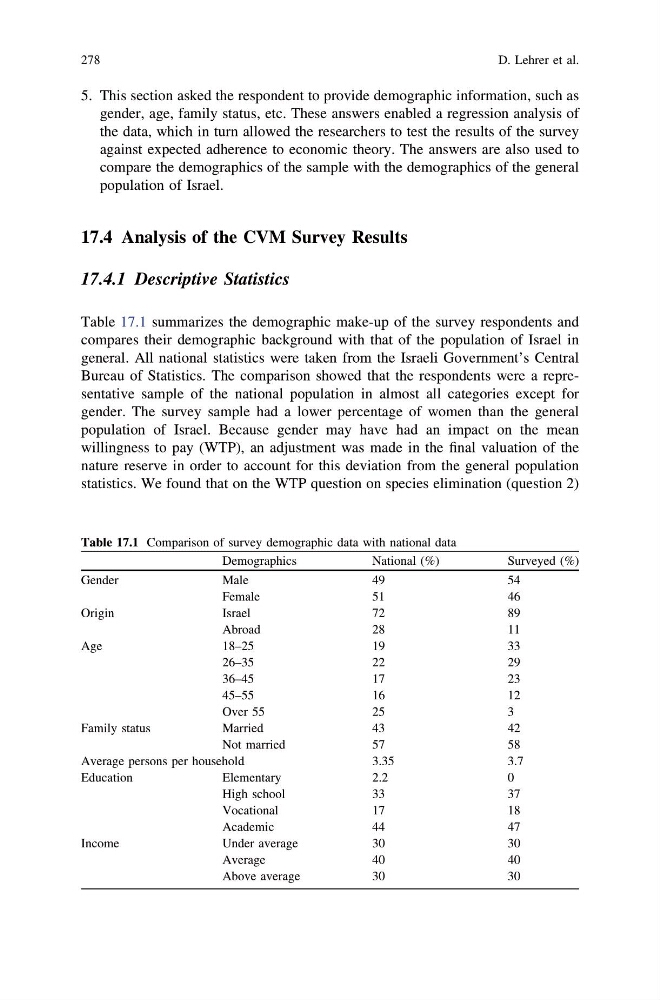
Table 17.1 summarizes the demographic make-up of the survey respondents and
compares their demographic background with that of the population of Israel in
general. All national statistics were taken from the Israeli Government’s Central
Bureau of Statistics. The comparison showed that the respondents were a representative sample of the national population in almost all categories except for
gender. The survey sample had a lower percentage of women than the general
population of Israel. Because gender may have had an impact on the mean
willingness to pay (WTP), an adjustment was made in the final valuation of the
nature reserve in order to account for this deviation from the general population
statistics. We found that on the WTP question on species elimination (question 2)
Table 17.1 Comparison of survey demographic data with national data
Demographics
National (%)
Surveyed (%)
Gender
Male
49
54
Female
51
46
Origin
Israel
72
89
Abroad
28
11
Age
18–25
19
33
26–35
22
29
36–45
17
23
45–55
16
12
Over 55
25
3
Family status
Married
43
42
Not married
57
58
Average persons per household
3.35
3.7
Education
Elementary
2.2
0
High school
33
37
Vocational
17
18
Academic
44
47
Income
Under average
30
30
Average
40
40
Above average
30
30
278
D. Lehrer et al.
gender, age, family status, etc. These answers enabled a regression analysis of
the data, which in turn allowed the researchers to test the results of the survey
against expected adherence to economic theory. The answers are also used to
compare the demographics of the sample with the demographics of the general
population of Israel.
17.4 Analysis of the CVM Survey Results
17.4.1 Descriptive Statistics
Table 17.1 summarizes the demographic make-up of the survey respondents and
compares their demographic background with that of the population of Israel in
general. All national statistics were taken from the Israeli Government’s Central
Bureau of Statistics. The comparison showed that the respondents were a representative sample of the national population in almost all categories except for
gender. The survey sample had a lower percentage of women than the general
population of Israel. Because gender may have had an impact on the mean
willingness to pay (WTP), an adjustment was made in the final valuation of the
nature reserve in order to account for this deviation from the general population
statistics. We found that on the WTP question on species elimination (question 2)
Table 17.1 Comparison of survey demographic data with national data
Demographics
National (%)
Surveyed (%)
Gender
Male
49
54
Female
51
46
Origin
Israel
72
89
Abroad
28
11
Age
18–25
19
33
26–35
22
29
36–45
17
23
45–55
16
12
Over 55
25
3
Family status
Married
43
42
Not married
57
58
Average persons per household
3.35
3.7
Education
Elementary
2.2
0
High school
33
37
Vocational
17
18
Academic
44
47
Income
Under average
30
30
Average
40
40
Above average
30
30
278
D. Lehrer et al.