

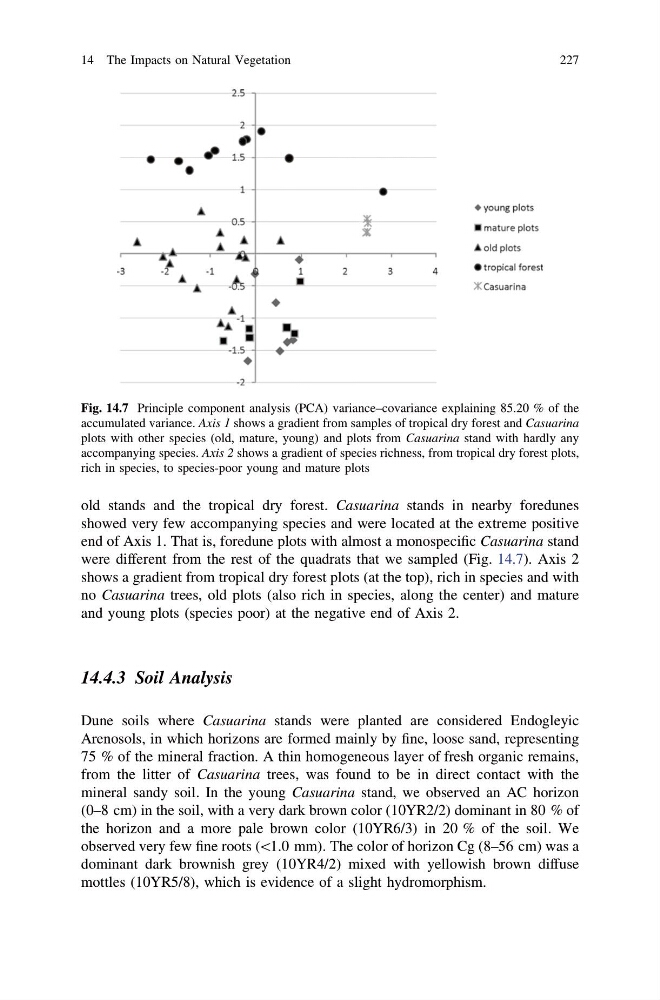
old stands and the tropical dry forest. Casuarina stands in nearby foredunes
showed very few accompanying species and were located at the extreme positive
end of Axis 1. That is, foredune plots with almost a monospecific Casuarina stand
were different from the rest of the quadrats that we sampled (Fig. 14.7). Axis 2
shows a gradient from tropical dry forest plots (at the top), rich in species and with
no Casuarina trees, old plots (also rich in species, along the center) and mature
and young plots (species poor) at the negative end of Axis 2.
14.4.3 Soil Analysis
Dune soils where Casuarina stands were planted are considered Endogleyic
Arenosols, in which horizons are formed mainly by fine, loose sand, representing
75 % of the mineral fraction. A thin homogeneous layer of fresh organic remains,
from the litter of Casuarina trees, was found to be in direct contact with the
mineral sandy soil. In the young Casuarina stand, we observed an AC horizon
(0–8 cm) in the soil, with a very dark brown color (10YR2/2) dominant in 80 % of
the horizon and a more pale brown color (10YR6/3) in 20 % of the soil. We
observed very few fine roots (\1.0 mm). The color of horizon Cg (8–56 cm) was a
dominant dark brownish grey (10YR4/2) mixed with yellowish brown diffuse
mottles (10YR5/8), which is evidence of a slight hydromorphism.
Fig. 14.7 Principle component analysis (PCA) variance–covariance explaining 85.20 % of the
accumulated variance. Axis 1 shows a gradient from samples of tropical dry forest and Casuarina
plots with other species (old, mature, young) and plots from Casuarina stand with hardly any
accompanying species. Axis 2 shows a gradient of species richness, from tropical dry forest plots,
rich in species, to species-poor young and mature plots
14 The Impacts on Natural Vegetation
227
showed very few accompanying species and were located at the extreme positive
end of Axis 1. That is, foredune plots with almost a monospecific Casuarina stand
were different from the rest of the quadrats that we sampled (Fig. 14.7). Axis 2
shows a gradient from tropical dry forest plots (at the top), rich in species and with
no Casuarina trees, old plots (also rich in species, along the center) and mature
and young plots (species poor) at the negative end of Axis 2.
14.4.3 Soil Analysis
Dune soils where Casuarina stands were planted are considered Endogleyic
Arenosols, in which horizons are formed mainly by fine, loose sand, representing
75 % of the mineral fraction. A thin homogeneous layer of fresh organic remains,
from the litter of Casuarina trees, was found to be in direct contact with the
mineral sandy soil. In the young Casuarina stand, we observed an AC horizon
(0–8 cm) in the soil, with a very dark brown color (10YR2/2) dominant in 80 % of
the horizon and a more pale brown color (10YR6/3) in 20 % of the soil. We
observed very few fine roots (\1.0 mm). The color of horizon Cg (8–56 cm) was a
dominant dark brownish grey (10YR4/2) mixed with yellowish brown diffuse
mottles (10YR5/8), which is evidence of a slight hydromorphism.
Fig. 14.7 Principle component analysis (PCA) variance–covariance explaining 85.20 % of the
accumulated variance. Axis 1 shows a gradient from samples of tropical dry forest and Casuarina
plots with other species (old, mature, young) and plots from Casuarina stand with hardly any
accompanying species. Axis 2 shows a gradient of species richness, from tropical dry forest plots,
rich in species, to species-poor young and mature plots
14 The Impacts on Natural Vegetation
227