

41.3.3 Aquaculture
According to the data provided by Romania’s Ministry of Agriculture and Rural
Development, in 2005, aquaculture facilities occupied an area of over 100.000 ha.
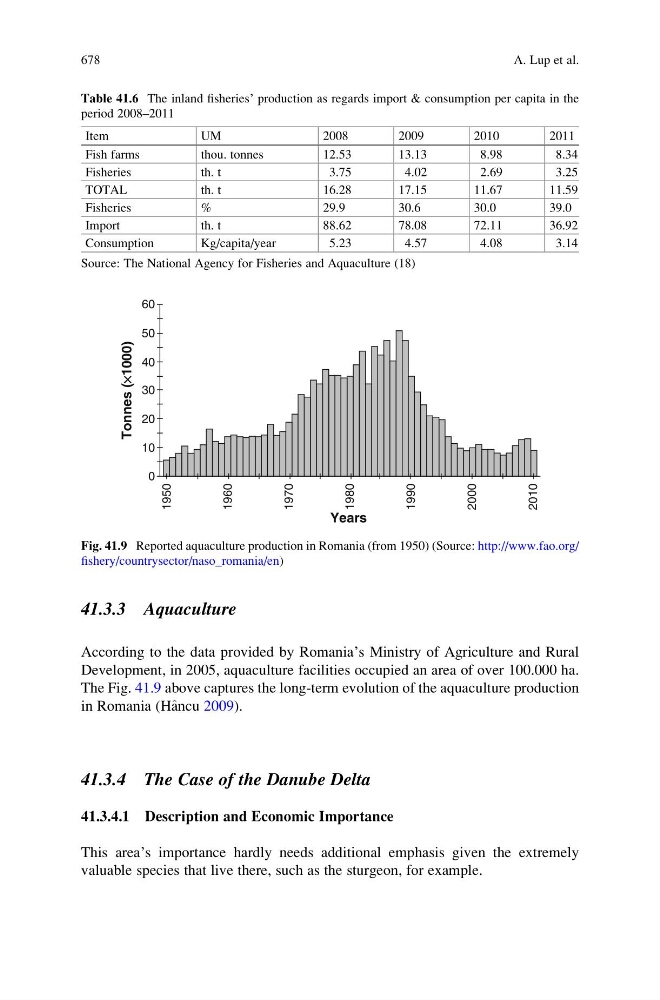
The Fig. 41.9 above captures the long-term evolution of the aquaculture production
in Romania (H^ ancu 2009).
41.3.4 The Case of the Danube Delta
41.3.4.1 Description and Economic Importance
This area’s importance hardly needs additional emphasis given the extremely
valuable species that live there, such as the sturgeon, for example.
Table 41.6 The inland fisheries’ production as regards import & consumption per capita in the
period 2008–2011
Item
UM
2008
2009
2010
2011
Fish farms
thou. tonnes
12.53
13.13
8.98
8.34
Fisheries
th. t
3.75
4.02
2.69
3.25
TOTAL
th. t
16.28
17.15
11.67
11.59
Fisheries
%
29.9
30.6
30.0
39.0
Import
th. t
88.62
78.08
72.11
36.92
Consumption
Kg/capita/year
5.23
4.57
4.08
3.14
Source: The National Agency for Fisheries and Aquaculture (18)
60
50
40
30
20
Years
Tonnes (¥1000)
10
0
1950
1960
1970
1980
1990
2000
2010
Fig. 41.9 Reported aquaculture production in Romania (from 1950) (Source: http://www.fao.org/
fishery/countrysector/naso_romania/en)
678
A. Lup et al.