

maintain wetlands, fauna and ichthyologic biodiversity, the fishing industry has a
minute contribution to the country’s GDP, 0.007–0.009%. Over the long-term
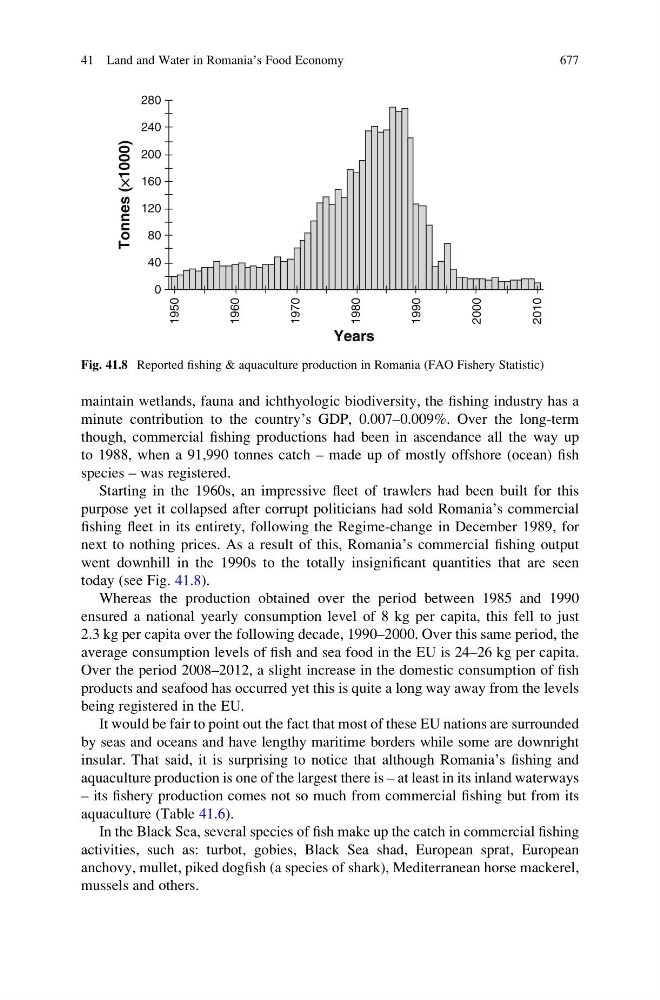
though, commercial fishing productions had been in ascendance all the way up
to 1988, when a 91,990 tonnes catch – made up of mostly offshore (ocean) fish
species – was registered.
Starting in the 1960s, an impressive fleet of trawlers had been built for this
purpose yet it collapsed after corrupt politicians had sold Romania’s commercial
fishing fleet in its entirety, following the Regime-change in December 1989, for
next to nothing prices. As a result of this, Romania’s commercial fishing output
went downhill in the 1990s to the totally insignificant quantities that are seen
today (see Fig. 41.8).
Whereas the production obtained over the period between 1985 and 1990
ensured a national yearly consumption level of 8 kg per capita, this fell to just
2.3 kg per capita over the following decade, 1990–2000. Over this same period, the
average consumption levels of fish and sea food in the EU is 24–26 kg per capita.
Over the period 2008–2012, a slight increase in the domestic consumption of fish
products and seafood has occurred yet this is quite a long way away from the levels
being registered in the EU.
It would be fair to point out the fact that most of these EU nations are surrounded
by seas and oceans and have lengthy maritime borders while some are downright
insular. That said, it is surprising to notice that although Romania’s fishing and
aquaculture production is one of the largest there is – at least in its inland waterways
– its fishery production comes not so much from commercial fishing but from its
aquaculture (Table 41.6).
In the Black Sea, several species of fish make up the catch in commercial fishing
activities, such as: turbot, gobies, Black Sea shad, European sprat, European
anchovy, mullet, piked dogfish (a species of shark), Mediterranean horse mackerel,
mussels and others.
280
240
200
160
120
80
40
0
1950
1960
1970
Years
Tonnes (¥1000)
1980
1990
2000
2010
Fig. 41.8 Reported fishing & aquaculture production in Romania (FAO Fishery Statistic)
41 Land and Water in Romania’s Food Economy
677