

pollutant for different sediment type (Klenkin et al. 2007). Ranging of studied area
by the values of M (ie the multiplicity average characteristic concentration) allows
to analyze distribution of the pollutants irrespective of its absolute content and type
of sediments. In particular: M 1 indicates the lack of ‘fresh or new’ receipts of
pollution into given area; M > 1 testifies about considerable (and permanently
acting)) anthropogenic load during the analyzed period of time. The lack of need in
determination of threshold or background concentrations is the main advantage of
such approach in comparison with other widely used quantitative criteria for
evaluation of environmental pollution (Hakanson 1980; Wilson and Jeffrey 1987;
Dauvalter 1997; Adami et al. 2000). In case of a wide spreading of the pollution, an
establishment of such values is not always possible or correct. Also, majority of
applied criteria do not take into account the composition of bottom sediments which
can be homogenous and heterogeneous both in different regions, and in borders of
the same area.
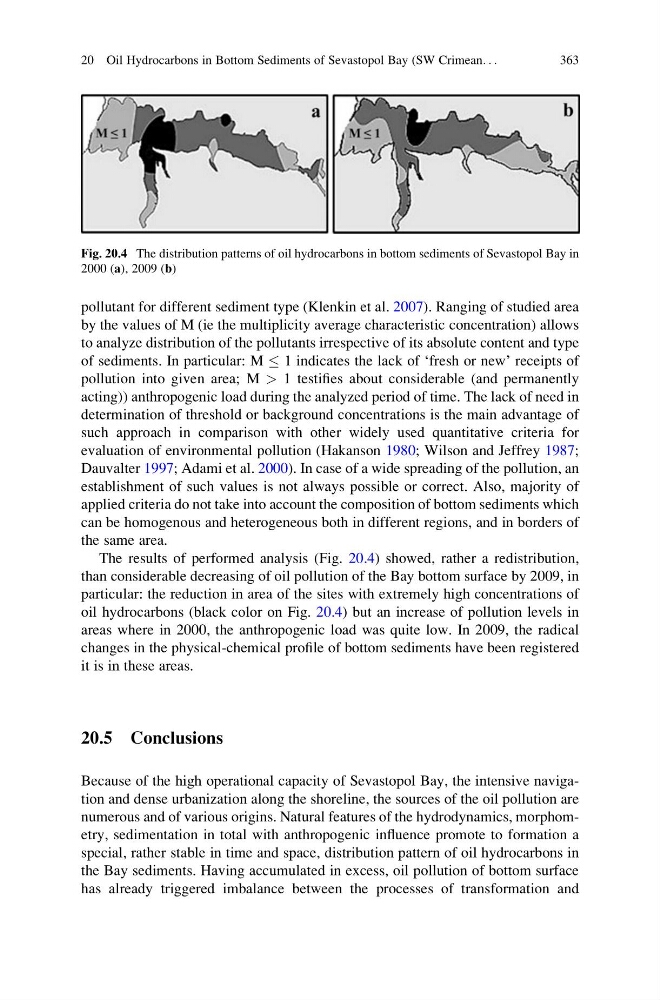
The results of performed analysis (Fig. 20.4) showed, rather a redistribution,
than considerable decreasing of oil pollution of the Bay bottom surface by 2009, in
particular: the reduction in area of the sites with extremely high concentrations of
oil hydrocarbons (black color on Fig. 20.4) but an increase of pollution levels in
areas where in 2000, the anthropogenic load was quite low. In 2009, the radical
changes in the physical-chemical profile of bottom sediments have been registered
it is in these areas.
20.5 Conclusions
Because of the high operational capacity of Sevastopol Bay, the intensive navigation and dense urbanization along the shoreline, the sources of the oil pollution are
numerous and of various origins. Natural features of the hydrodynamics, morphometry, sedimentation in total with anthropogenic influence promote to formation a
special, rather stable in time and space, distribution pattern of oil hydrocarbons in
the Bay sediments. Having accumulated in excess, oil pollution of bottom surface
has already triggered imbalance between the processes of transformation and
Fig. 20.4 The distribution patterns of oil hydrocarbons in bottom sediments of Sevastopol Bay in
2000 (a), 2009 (b)
20 Oil Hydrocarbons in Bottom Sediments of Sevastopol Bay (SW Crimean. . .
363
by the values of M (ie the multiplicity average characteristic concentration) allows
to analyze distribution of the pollutants irrespective of its absolute content and type
of sediments. In particular: M 1 indicates the lack of ‘fresh or new’ receipts of
pollution into given area; M > 1 testifies about considerable (and permanently
acting)) anthropogenic load during the analyzed period of time. The lack of need in
determination of threshold or background concentrations is the main advantage of
such approach in comparison with other widely used quantitative criteria for
evaluation of environmental pollution (Hakanson 1980; Wilson and Jeffrey 1987;
Dauvalter 1997; Adami et al. 2000). In case of a wide spreading of the pollution, an
establishment of such values is not always possible or correct. Also, majority of
applied criteria do not take into account the composition of bottom sediments which
can be homogenous and heterogeneous both in different regions, and in borders of
the same area.
The results of performed analysis (Fig. 20.4) showed, rather a redistribution,
than considerable decreasing of oil pollution of the Bay bottom surface by 2009, in
particular: the reduction in area of the sites with extremely high concentrations of
oil hydrocarbons (black color on Fig. 20.4) but an increase of pollution levels in
areas where in 2000, the anthropogenic load was quite low. In 2009, the radical
changes in the physical-chemical profile of bottom sediments have been registered
it is in these areas.
20.5 Conclusions
Because of the high operational capacity of Sevastopol Bay, the intensive navigation and dense urbanization along the shoreline, the sources of the oil pollution are
numerous and of various origins. Natural features of the hydrodynamics, morphometry, sedimentation in total with anthropogenic influence promote to formation a
special, rather stable in time and space, distribution pattern of oil hydrocarbons in
the Bay sediments. Having accumulated in excess, oil pollution of bottom surface
has already triggered imbalance between the processes of transformation and
Fig. 20.4 The distribution patterns of oil hydrocarbons in bottom sediments of Sevastopol Bay in
2000 (a), 2009 (b)
20 Oil Hydrocarbons in Bottom Sediments of Sevastopol Bay (SW Crimean. . .
363