

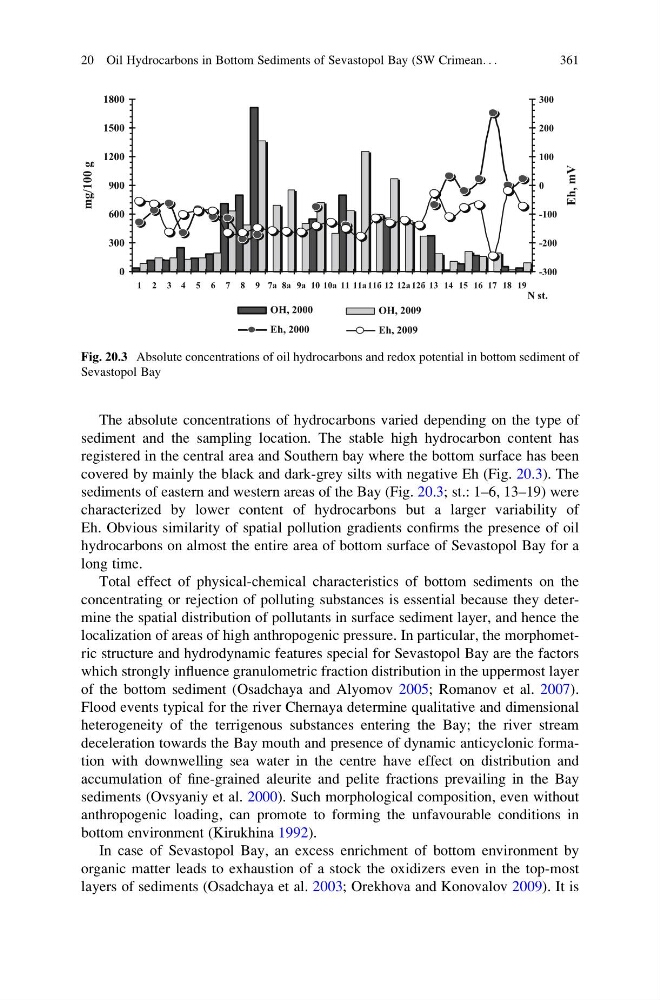
The absolute concentrations of hydrocarbons varied depending on the type of
sediment and the sampling location. The stable high hydrocarbon content has
registered in the central area and Southern bay where the bottom surface has been
covered by mainly the black and dark-grey silts with negative Eh (Fig. 20.3). The
sediments of eastern and western areas of the Bay (Fig. 20.3; st.: 1–6, 13–19) were
characterized by lower content of hydrocarbons but a larger variability of
Eh. Obvious similarity of spatial pollution gradients confirms the presence of oil
hydrocarbons on almost the entire area of bottom surface of Sevastopol Bay for a
long time.
Total effect of physical-chemical characteristics of bottom sediments on the
concentrating or rejection of polluting substances is essential because they determine the spatial distribution of pollutants in surface sediment layer, and hence the
localization of areas of high anthropogenic pressure. In particular, the morphometric structure and hydrodynamic features special for Sevastopol Bay are the factors
which strongly influence granulometric fraction distribution in the uppermost layer
of the bottom sediment (Osadchaya and Alyomov 2005; Romanov et al. 2007).
Flood events typical for the river Chernaya determine qualitative and dimensional
heterogeneity of the terrigenous substances entering the Bay; the river stream
deceleration towards the Bay mouth and presence of dynamic anticyclonic formation with downwelling sea water in the centre have effect on distribution and
accumulation of fine-grained aleurite and pelite fractions prevailing in the Bay
sediments (Ovsyaniy et al. 2000). Such morphological composition, even without
anthropogenic loading, can promote to forming the unfavourable conditions in
bottom environment (Kirukhina 1992).
In case of Sevastopol Bay, an excess enrichment of bottom environment by
organic matter leads to exhaustion of a stock the oxidizers even in the top-most
layers of sediments (Osadchaya et al. 2003; Orekhova and Konovalov 2009). It is
0
300
600
900
1200
1500
1800
1 2 3 4 5 6 7 8 9 7а 8а 9а 10 10а 11 11а 11б 12 12а 12б 13 14 15 16 17 18 19
-300
-200
-100
0
100
200
300
OH, 2000
OH, 2009
Eh, 2000
Eh, 2009
mg/100 g
Eh, mV
N st.
Fig. 20.3 Absolute concentrations of oil hydrocarbons and redox potential in bottom sediment of
Sevastopol Bay
20 Oil Hydrocarbons in Bottom Sediments of Sevastopol Bay (SW Crimean. . .
361
sediment and the sampling location. The stable high hydrocarbon content has
registered in the central area and Southern bay where the bottom surface has been
covered by mainly the black and dark-grey silts with negative Eh (Fig. 20.3). The
sediments of eastern and western areas of the Bay (Fig. 20.3; st.: 1–6, 13–19) were
characterized by lower content of hydrocarbons but a larger variability of
Eh. Obvious similarity of spatial pollution gradients confirms the presence of oil
hydrocarbons on almost the entire area of bottom surface of Sevastopol Bay for a
long time.
Total effect of physical-chemical characteristics of bottom sediments on the
concentrating or rejection of polluting substances is essential because they determine the spatial distribution of pollutants in surface sediment layer, and hence the
localization of areas of high anthropogenic pressure. In particular, the morphometric structure and hydrodynamic features special for Sevastopol Bay are the factors
which strongly influence granulometric fraction distribution in the uppermost layer
of the bottom sediment (Osadchaya and Alyomov 2005; Romanov et al. 2007).
Flood events typical for the river Chernaya determine qualitative and dimensional
heterogeneity of the terrigenous substances entering the Bay; the river stream
deceleration towards the Bay mouth and presence of dynamic anticyclonic formation with downwelling sea water in the centre have effect on distribution and
accumulation of fine-grained aleurite and pelite fractions prevailing in the Bay
sediments (Ovsyaniy et al. 2000). Such morphological composition, even without
anthropogenic loading, can promote to forming the unfavourable conditions in
bottom environment (Kirukhina 1992).
In case of Sevastopol Bay, an excess enrichment of bottom environment by
organic matter leads to exhaustion of a stock the oxidizers even in the top-most
layers of sediments (Osadchaya et al. 2003; Orekhova and Konovalov 2009). It is
0
300
600
900
1200
1500
1800
1 2 3 4 5 6 7 8 9 7а 8а 9а 10 10а 11 11а 11б 12 12а 12б 13 14 15 16 17 18 19
-300
-200
-100
0
100
200
300
OH, 2000
OH, 2009
Eh, 2000
Eh, 2009
mg/100 g
Eh, mV
N st.
Fig. 20.3 Absolute concentrations of oil hydrocarbons and redox potential in bottom sediment of
Sevastopol Bay
20 Oil Hydrocarbons in Bottom Sediments of Sevastopol Bay (SW Crimean. . .
361