

affects the speed of regeneration of nutrients, that is described by inverse relationship between the average monthly values of regeneration flux and K Z (Fig. 19.3). In
summer, the high stability of the water layer and minimum values of K Z , the
average observed in more than three-fold increase of regeneration flux compared
with cold period of the year.
The increasing of the part of “new”/export production with increasing trophic
status of water is expressed in the functional dependencies between the values of
f-ratio and nitrate content in the medium, the concentration of chlorophyll “a”,
phytoplankton biomass, primary production, obtained in different regions of the
ocean and generalized in several previously published studies (Falkowski et al.
2003; Dunne et al. 2005). Similar dependences were obtained by us for the Black
Sea when comparing the monthly averages of F P and related integrated assessments
and hydro-chemical the productive indicators in the photic layer (Fig. 19.4).
The relationship between the F P and integral values of phosphate content in the
layer of 0–40 m is described by the logarithmic function with the coefficient of
determination of 0.86 (Fig. 19.4a). Earlier, a similar relationship between the
content of nitrate in the environment and the value of f-ratio was obtained for
ocean waters (Platt and Harrison 1985; Harrison et al. 1987; Murray et al. 1989), as
well as the Black Sea (Krivenko 2005). The general laws correspond the accumulation of phytoplankton biomass in areas with higher values of f/e-ratio. Its reflection its the relationship between monthly average data of the Fp and concentration
chlorophyll “a” calculated according to (Vedernikov and Demidov 1997)
(Fig. 19.4b), and also according to the phytoplankton biomass (Krivenko and
Parkhomenko 2010) (Fig. 19.4c) for photosynthesis zone deep sea area. These
dependences are well described by a logarithmic function with coefficients of
determination of 0.62 for the “a” chlorophyll (Fig. 19.4b) and 0.70 for biomass of
phytoplankton (Fig. 19.4c). Thus, the nature of obtained dependences corresponds
to the general laws of formation of the “new” and regenerative products in general,
in the oceans, and the Black Sea in particular.
1
2
3
4
5
6
7
8
9 10 11 12
Months
0
20
40
60
80
100
Fp,%
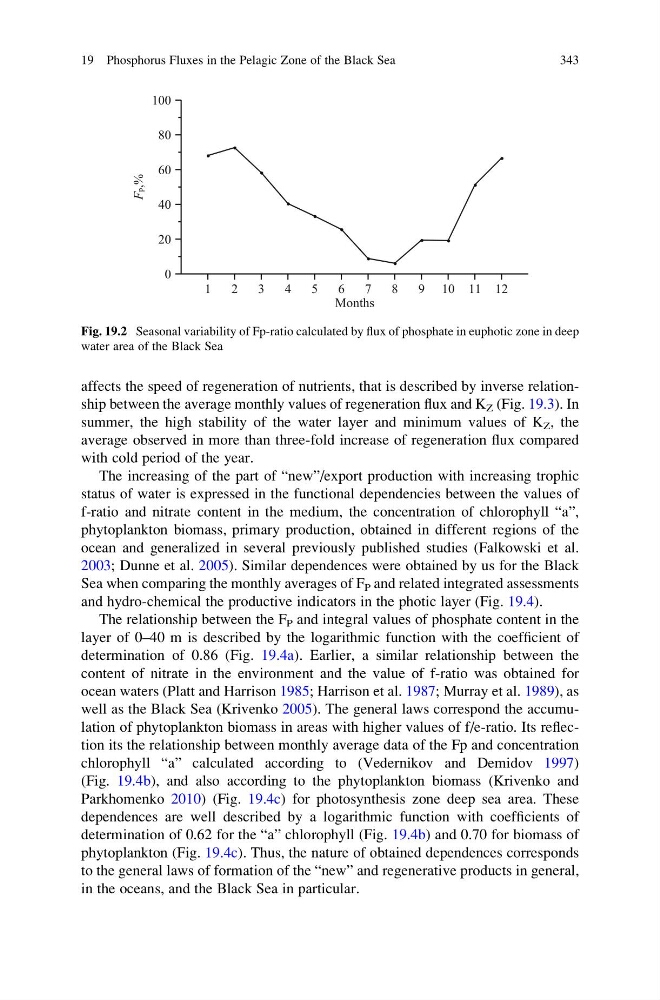
Fig. 19.2 Seasonal variability of Fp-ratio calculated by flux of phosphate in euphotic zone in deep
water area of the Black Sea
19 Phosphorus Fluxes in the Pelagic Zone of the Black Sea
343
summer, the high stability of the water layer and minimum values of K Z , the
average observed in more than three-fold increase of regeneration flux compared
with cold period of the year.
The increasing of the part of “new”/export production with increasing trophic
status of water is expressed in the functional dependencies between the values of
f-ratio and nitrate content in the medium, the concentration of chlorophyll “a”,
phytoplankton biomass, primary production, obtained in different regions of the
ocean and generalized in several previously published studies (Falkowski et al.
2003; Dunne et al. 2005). Similar dependences were obtained by us for the Black
Sea when comparing the monthly averages of F P and related integrated assessments
and hydro-chemical the productive indicators in the photic layer (Fig. 19.4).
The relationship between the F P and integral values of phosphate content in the
layer of 0–40 m is described by the logarithmic function with the coefficient of
determination of 0.86 (Fig. 19.4a). Earlier, a similar relationship between the
content of nitrate in the environment and the value of f-ratio was obtained for
ocean waters (Platt and Harrison 1985; Harrison et al. 1987; Murray et al. 1989), as
well as the Black Sea (Krivenko 2005). The general laws correspond the accumulation of phytoplankton biomass in areas with higher values of f/e-ratio. Its reflection its the relationship between monthly average data of the Fp and concentration
chlorophyll “a” calculated according to (Vedernikov and Demidov 1997)
(Fig. 19.4b), and also according to the phytoplankton biomass (Krivenko and
Parkhomenko 2010) (Fig. 19.4c) for photosynthesis zone deep sea area. These
dependences are well described by a logarithmic function with coefficients of
determination of 0.62 for the “a” chlorophyll (Fig. 19.4b) and 0.70 for biomass of
phytoplankton (Fig. 19.4c). Thus, the nature of obtained dependences corresponds
to the general laws of formation of the “new” and regenerative products in general,
in the oceans, and the Black Sea in particular.
1
2
3
4
5
6
7
8
9 10 11 12
Months
0
20
40
60
80
100
Fp,%
Fig. 19.2 Seasonal variability of Fp-ratio calculated by flux of phosphate in euphotic zone in deep
water area of the Black Sea
19 Phosphorus Fluxes in the Pelagic Zone of the Black Sea
343