

In a 2002 study, Gulin et al. investigated the
137 Cs,
238 Pu,
239 +
240 Pu, and
241 Am
activity profiles in sediments collected from the Danube and Dnieper Deltas. In
surface sediments (0–5 cm), a distinct enhancement of
137 Cs was evident in the
vicinities of the river mouths, with activities diminishing vs distance;
137 Cs inventories were 1–2 orders of magnitude higher in the deltas vs remote locations. Gulin
et al.’s Danube core revealed a
137 Cs activity peak associated with 1963 stratospheric fallout, as well as a more recent, higher-activity peak associated with
Chernobyl. The
238 Pu and
239+240 Pu activity profiles exhibited similar features,
dated as 1991 and 1993 from hydrologic data. The presence of high
241 Am
activities,
241 Am/
239+240 Pu activity ratios of ~1, and
238 Pu/
239 +
240 Pu exceeding
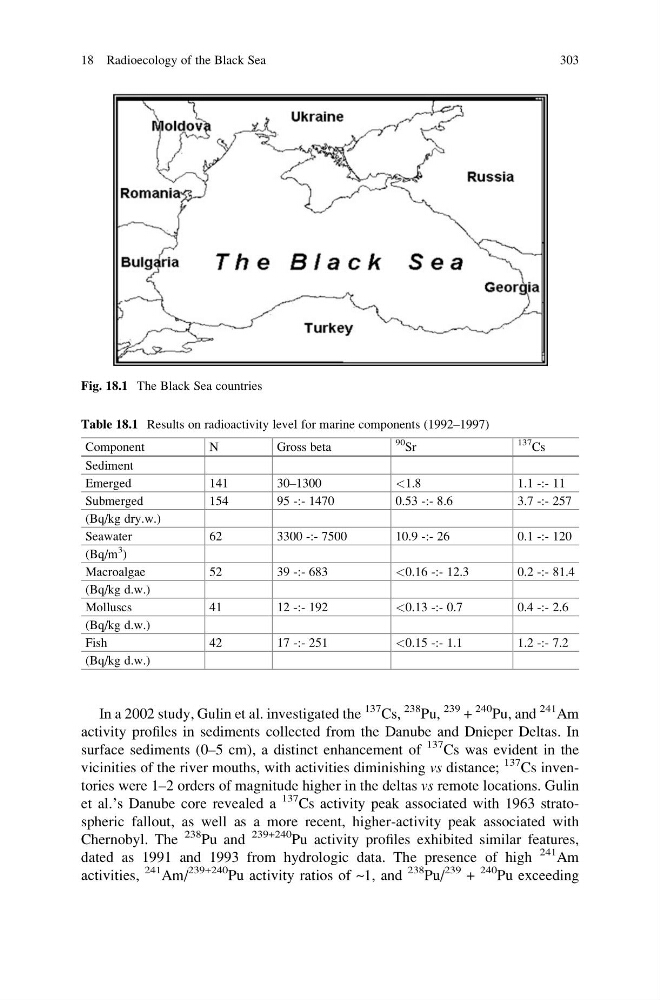
Fig. 18.1 The Black Sea countries
Table 18.1 Results on radioactivity level for marine components (1992–1997)
Component
N
Gross beta
90
Sr
137
Cs
Sediment
Emerged
141
30–1300
<1.8
1.1 -:- 11
Submerged
154
95 -:- 1470
0.53 -:- 8.6
3.7 -:- 257
(Bq/kg dry.w.)
Seawater
62
3300 -:- 7500
10.9 -:- 26
0.1 -:- 120
(Bq/m
3
)
Macroalgae
52
39 -:- 683
<0.16 -:- 12.3
0.2 -:- 81.4
(Bq/kg d.w.)
Molluscs
41
12 -:- 192
<0.13 -:- 0.7
0.4 -:- 2.6
(Bq/kg d.w.)
Fish
42
17 -:- 251
<0.15 -:- 1.1
1.2 -:- 7.2
(Bq/kg d.w.)
18 Radioecology of the Black Sea
303
137 Cs,
238 Pu,
239 +
240 Pu, and
241 Am
activity profiles in sediments collected from the Danube and Dnieper Deltas. In
surface sediments (0–5 cm), a distinct enhancement of
137 Cs was evident in the
vicinities of the river mouths, with activities diminishing vs distance;
137 Cs inventories were 1–2 orders of magnitude higher in the deltas vs remote locations. Gulin
et al.’s Danube core revealed a
137 Cs activity peak associated with 1963 stratospheric fallout, as well as a more recent, higher-activity peak associated with
Chernobyl. The
238 Pu and
239+240 Pu activity profiles exhibited similar features,
dated as 1991 and 1993 from hydrologic data. The presence of high
241 Am
activities,
241 Am/
239+240 Pu activity ratios of ~1, and
238 Pu/
239 +
240 Pu exceeding
Fig. 18.1 The Black Sea countries
Table 18.1 Results on radioactivity level for marine components (1992–1997)
Component
N
Gross beta
90
Sr
137
Cs
Sediment
Emerged
141
30–1300
<1.8
1.1 -:- 11
Submerged
154
95 -:- 1470
0.53 -:- 8.6
3.7 -:- 257
(Bq/kg dry.w.)
Seawater
62
3300 -:- 7500
10.9 -:- 26
0.1 -:- 120
(Bq/m
3
)
Macroalgae
52
39 -:- 683
<0.16 -:- 12.3
0.2 -:- 81.4
(Bq/kg d.w.)
Molluscs
41
12 -:- 192
<0.13 -:- 0.7
0.4 -:- 2.6
(Bq/kg d.w.)
Fish
42
17 -:- 251
<0.15 -:- 1.1
1.2 -:- 7.2
(Bq/kg d.w.)
18 Radioecology of the Black Sea
303