

90
5 Challenges: Sectoral Descriptions
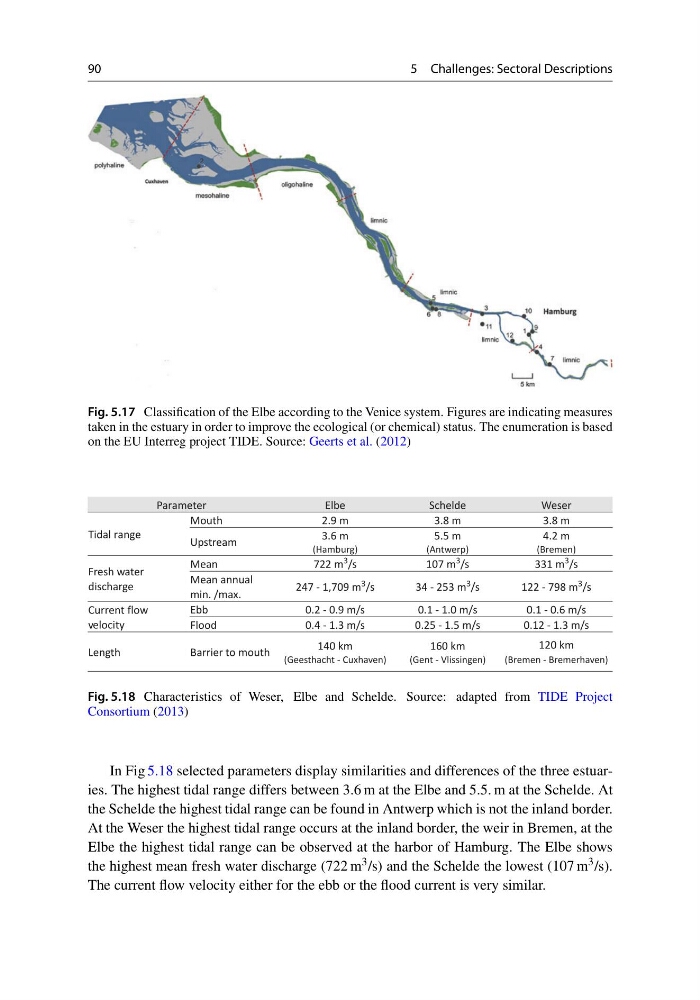
Fig. 5.17 Classification of the Elbe according to the Venice system. Figures are indicating measures
taken in the estuary in order to improve the ecological (or chemical) status. The enumeration is based
on the EU Interreg project TIDE. Source: Geerts et al. (2012)
Parameter
Elbe
Schelde
Weser
Tidal range
Mouth
Upstream
Fresh water
discharge
Mean
Mean annual
min. /max.
Current flow
velocity
Ebb
Flood
Length
Barrier to mouth
2.9 m
3.6 m
(Hamburg)
722 m
3 /s
247 - 1,709 m
3 /s
0.2 - 0.9 m/s
0.4 - 1.3 m/s
140 km
(Geesthacht - Cuxhaven)
3.8 m
5.5 m
(Antwerp)
107 m
3 /s
34 - 253 m 3 /s
0.1 - 1.0 m/s
0.25 - 1.5 m/s
160 km
(Gent - Vlissingen)
3.8 m
4.2 m
(Bremen)
331 m
3 /s
122 - 798 m 3 /s
0.1 - 0.6 m/s
0.12 - 1.3 m/s
120 km
(Bremen - Bremerhaven)
Fig. 5.18 Characteristics of Weser, Elbe and Schelde. Source: adapted from TIDE Project
Consortium (2013)
In Fig 5.18 selected parameters display similarities and differences of the three estuaries. The highest tidal range differs between 3.6 m at the Elbe and 5.5. m at the Schelde. At
the Schelde the highest tidal range can be found in Antwerp which is not the inland border.
At the Weser the highest tidal range occurs at the inland border, the weir in Bremen, at the
Elbe the highest tidal range can be observed at the harbor of Hamburg. The Elbe shows
the highest mean fresh water discharge (722 m 3 /s) and the Schelde the lowest (107 m 3 /s).
The current flow velocity either for the ebb or the flood current is very similar.
5 Challenges: Sectoral Descriptions
Fig. 5.17 Classification of the Elbe according to the Venice system. Figures are indicating measures
taken in the estuary in order to improve the ecological (or chemical) status. The enumeration is based
on the EU Interreg project TIDE. Source: Geerts et al. (2012)
Parameter
Elbe
Schelde
Weser
Tidal range
Mouth
Upstream
Fresh water
discharge
Mean
Mean annual
min. /max.
Current flow
velocity
Ebb
Flood
Length
Barrier to mouth
2.9 m
3.6 m
(Hamburg)
722 m
3 /s
247 - 1,709 m
3 /s
0.2 - 0.9 m/s
0.4 - 1.3 m/s
140 km
(Geesthacht - Cuxhaven)
3.8 m
5.5 m
(Antwerp)
107 m
3 /s
34 - 253 m 3 /s
0.1 - 1.0 m/s
0.25 - 1.5 m/s
160 km
(Gent - Vlissingen)
3.8 m
4.2 m
(Bremen)
331 m
3 /s
122 - 798 m 3 /s
0.1 - 0.6 m/s
0.12 - 1.3 m/s
120 km
(Bremen - Bremerhaven)
Fig. 5.18 Characteristics of Weser, Elbe and Schelde. Source: adapted from TIDE Project
Consortium (2013)
In Fig 5.18 selected parameters display similarities and differences of the three estuaries. The highest tidal range differs between 3.6 m at the Elbe and 5.5. m at the Schelde. At
the Schelde the highest tidal range can be found in Antwerp which is not the inland border.
At the Weser the highest tidal range occurs at the inland border, the weir in Bremen, at the
Elbe the highest tidal range can be observed at the harbor of Hamburg. The Elbe shows
the highest mean fresh water discharge (722 m 3 /s) and the Schelde the lowest (107 m 3 /s).
The current flow velocity either for the ebb or the flood current is very similar.