

Morphology and Flow in Streams
59
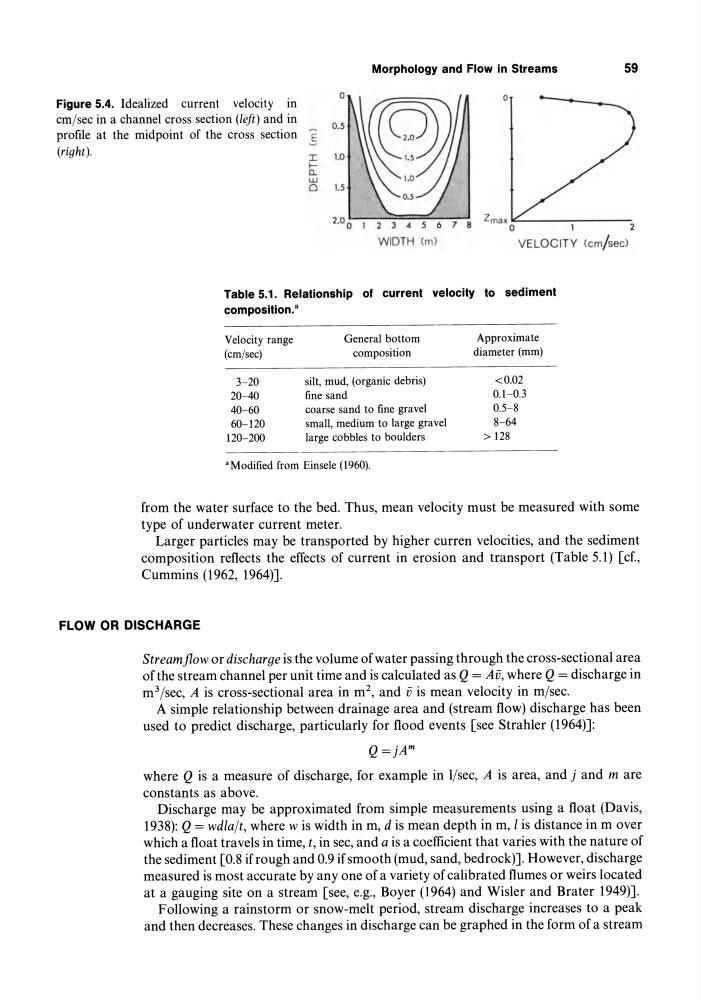
Figure 5.4. Idealized current velocity in
em/sec in a channel cross section (left) and in
profile at the midpoint of the cross section E
o
(right).
I
Ia..
w
o
Zmax ~ ____________ ~
o
2
VE LOC ITY (em/ sec)
Table 5.1. Relationship of current velocity to sediment
composition. a
Velocity range
(em/sec)
3-20
20- 40
40-60
60-120
120-200
General bottom
composition
silt, mud, (organic debris)
fine sand
coarse sand to fine gravel
small, medium to large gravel
large cobbles to boulders
a Modified from Einsele (1960).
Approximate
diameter (mm)
<0.02
0.1-0.3
0.5-8
8-64
> 128
from the water surface to the bed. Thus, mean velocity must be measured with some
type of underwater current meter.
Larger particles may be transported by higher curren velocities, and the sediment
composition reflects the effects of current in erosion and transport (Table 5.1) [cf.,
Cummins (1962, 1964)].
FLOW OR DISCHARGE
Streamflow or discharge is the volume of water passing through the cross-sectional area
ofthe stream channel per unit time and is calculated as Q = Aii, where Q = discharge in
m 3 / sec, A is cross-sectional area in m 2 , and ii is mean velocity in m/sec.
A simple relationship between drainage area and (stream flow) discharge has been
used to predict discharge, particularly for flood events [see Strahler (1964)]:
where Q is a measure of discharge, for example in l/sec, A is area, and j and mare
constants as above.
Discharge may be approximated from simple measurements using a float (Davis,
1938): Q = wdla/t, where w is width in m, d is mean depth in m, I is distance in mover
which a float travels in time, t, in sec, and a is a coefficient that varies with the nature of
the sediment [0.8 if rough and 0.9 if smooth (mud, sand, bedrock)]. However, discharge
measured is most accurate by anyone of a variety of calibrated flumes or weirs located
at a gauging site on a stream [see, e.g., Boyer (1964) and Wisler and Brater 1949)].
Following a rainstorm or snow-melt period, stream discharge increases to a peak
and then decreases. These changes in discharge can be graphed in the form of a stream
59
Figure 5.4. Idealized current velocity in
em/sec in a channel cross section (left) and in
profile at the midpoint of the cross section E
o
(right).
I
Ia..
w
o
Zmax ~ ____________ ~
o
2
VE LOC ITY (em/ sec)
Table 5.1. Relationship of current velocity to sediment
composition. a
Velocity range
(em/sec)
3-20
20- 40
40-60
60-120
120-200
General bottom
composition
silt, mud, (organic debris)
fine sand
coarse sand to fine gravel
small, medium to large gravel
large cobbles to boulders
a Modified from Einsele (1960).
Approximate
diameter (mm)
<0.02
0.1-0.3
0.5-8
8-64
> 128
from the water surface to the bed. Thus, mean velocity must be measured with some
type of underwater current meter.
Larger particles may be transported by higher curren velocities, and the sediment
composition reflects the effects of current in erosion and transport (Table 5.1) [cf.,
Cummins (1962, 1964)].
FLOW OR DISCHARGE
Streamflow or discharge is the volume of water passing through the cross-sectional area
ofthe stream channel per unit time and is calculated as Q = Aii, where Q = discharge in
m 3 / sec, A is cross-sectional area in m 2 , and ii is mean velocity in m/sec.
A simple relationship between drainage area and (stream flow) discharge has been
used to predict discharge, particularly for flood events [see Strahler (1964)]:
where Q is a measure of discharge, for example in l/sec, A is area, and j and mare
constants as above.
Discharge may be approximated from simple measurements using a float (Davis,
1938): Q = wdla/t, where w is width in m, d is mean depth in m, I is distance in mover
which a float travels in time, t, in sec, and a is a coefficient that varies with the nature of
the sediment [0.8 if rough and 0.9 if smooth (mud, sand, bedrock)]. However, discharge
measured is most accurate by anyone of a variety of calibrated flumes or weirs located
at a gauging site on a stream [see, e.g., Boyer (1964) and Wisler and Brater 1949)].
Following a rainstorm or snow-melt period, stream discharge increases to a peak
and then decreases. These changes in discharge can be graphed in the form of a stream