

34
Exercise 3
planimetrically (see Exercise 2) or by counting squares, and the sum thus arrived at is
divided by Ao (surface area of the lake). Since the area at all depths is the same in the
simplified case of the aquarium, the heat budget will be given directly as the integral
from z = 0 to z = max of (ts.z - tw,z) dz. When the measurements of depth are recorded
in centimeters and the heat capacity of water at all temperatures is taken as 1 g cal cm 3 ,
the integral will, with small error, be given in gram-calories per cm 2 , or langleys, the
usual units for heat budget values. * (Be certain that the origins for both axes of your
plot are set at zero. Why is this a problem in limnology?) What then is the "annual"
Birgean heat budget for the aquarium lake?
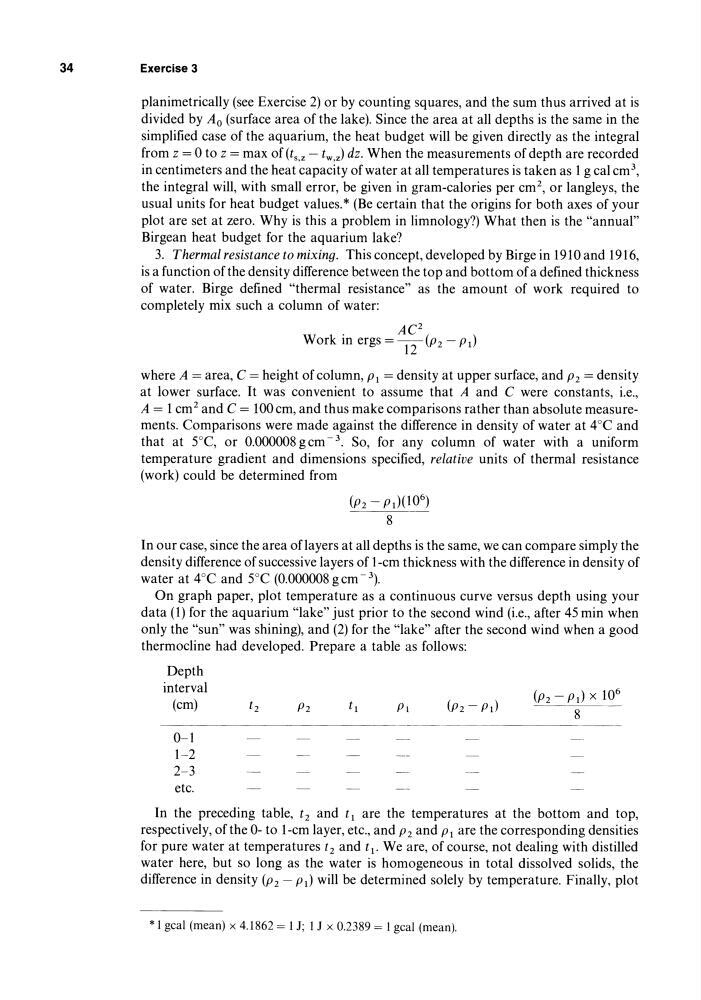
3. Thermal resistance to mixing. This concept, developed by Birge in 1910 and 1916,
is a function of the density difference between the top and bottom of a defined thickness
of water. Birge defined "thermal resistance" as the amount of work required to
completely mix such a column of water:
AC 2
Work in ergs = 12(p2 - PI)
where A = area, C = height of column, PI = density at upper surface, and P2 = density
at lower surface. It was convenient to assume that A and C were constants, i.e.,
A = 1 cm 2 and C = 100cm, and thus make comparisons rather than absolute measurements. Comparisons were made against the difference in density of water at 4°C and
that at 5°C, or 0.000008 g cm - 3. So, for any column of water with a uniform
temperature gradient and dimensions specified, relative units of thermal resistance
(work) could be determined from
In our case, since the area oflayers at all depths is the same, we can compare simply the
density difference of successive layers of l-cm thickness with the difference in density of
water at 4°C and 5°C (0.000008 g cm - 3).
On graph paper, plot temperature as a continuous curve versus depth using your
data (1) for the aquarium "lake" just prior to the second wind (i.e., after 45 min when
only the "sun" was shining), and (2) for the "lake" after the second wind when a good
thermocline had developed. Prepare a table as follows:
Depth
interval
(cm)
0-1
1-2
2-3
etc.
PI
In the preceding table, t2 and t1 are the temperatures at the bottom and top,
respectively, of the 0- to l-cm layer, etc., and P2 and PI are the corresponding densities
for pure water at temperatures t2 and t1. We are, of course, not dealing with distilled
water here, but so long as the water is homogeneous in total dissolved solids, the
difference in density (P2 - PI) will be determined solely by temperature. Finally, plot
* 1 gcaJ (mean) x 4.1862 = 1 J; 1 J x 0.2389 = 1 gcaJ (mean).
Exercise 3
planimetrically (see Exercise 2) or by counting squares, and the sum thus arrived at is
divided by Ao (surface area of the lake). Since the area at all depths is the same in the
simplified case of the aquarium, the heat budget will be given directly as the integral
from z = 0 to z = max of (ts.z - tw,z) dz. When the measurements of depth are recorded
in centimeters and the heat capacity of water at all temperatures is taken as 1 g cal cm 3 ,
the integral will, with small error, be given in gram-calories per cm 2 , or langleys, the
usual units for heat budget values. * (Be certain that the origins for both axes of your
plot are set at zero. Why is this a problem in limnology?) What then is the "annual"
Birgean heat budget for the aquarium lake?
3. Thermal resistance to mixing. This concept, developed by Birge in 1910 and 1916,
is a function of the density difference between the top and bottom of a defined thickness
of water. Birge defined "thermal resistance" as the amount of work required to
completely mix such a column of water:
AC 2
Work in ergs = 12(p2 - PI)
where A = area, C = height of column, PI = density at upper surface, and P2 = density
at lower surface. It was convenient to assume that A and C were constants, i.e.,
A = 1 cm 2 and C = 100cm, and thus make comparisons rather than absolute measurements. Comparisons were made against the difference in density of water at 4°C and
that at 5°C, or 0.000008 g cm - 3. So, for any column of water with a uniform
temperature gradient and dimensions specified, relative units of thermal resistance
(work) could be determined from
In our case, since the area oflayers at all depths is the same, we can compare simply the
density difference of successive layers of l-cm thickness with the difference in density of
water at 4°C and 5°C (0.000008 g cm - 3).
On graph paper, plot temperature as a continuous curve versus depth using your
data (1) for the aquarium "lake" just prior to the second wind (i.e., after 45 min when
only the "sun" was shining), and (2) for the "lake" after the second wind when a good
thermocline had developed. Prepare a table as follows:
Depth
interval
(cm)
0-1
1-2
2-3
etc.
PI
In the preceding table, t2 and t1 are the temperatures at the bottom and top,
respectively, of the 0- to l-cm layer, etc., and P2 and PI are the corresponding densities
for pure water at temperatures t2 and t1. We are, of course, not dealing with distilled
water here, but so long as the water is homogeneous in total dissolved solids, the
difference in density (P2 - PI) will be determined solely by temperature. Finally, plot
* 1 gcaJ (mean) x 4.1862 = 1 J; 1 J x 0.2389 = 1 gcaJ (mean).