

28
Exercise 2
°c ON DATES
DEPTH 10 Sept. 24 Sept. 8 Oct.
(m)
0
,l
0
20.8
I I
17.0 : : 13.4
I I
I
I
I I
20.8 I I 17.0 I 113.3
2 ~
I I
I I
2
I I
17.0 : : 13.3
J
20.6 I I
I
3
20.1,
I
17.0 I I 13.3
4
,,' I
4
19.7 , 17.0 : I 13.3
II
,
, ,
]
19.4
, 17.0 : : 13.3
6
5
I
-
I
, ,
I
-16
6
18.2,'
16.8; I 13.3
r-14
**.!_--- -*-",'
CL
-12 ______
7
14.4
15.1 " 13.3
w
8
0
**c.: . . . . - - - -X"
13.1
-10-.........
8
11.7 ",12.2
" "
- * - -- -- *
9.9
, , ',,~0:.1 ____ 1_1;.2
10
9
10
8.9
8.8
9.4
11
8.1
8.2
8.4
12
- 8 - . -
12
" 8.0- - - - * 8.0- - -*8.0
SEPT.
OCT.
12.5
7.6
7.6
7.8
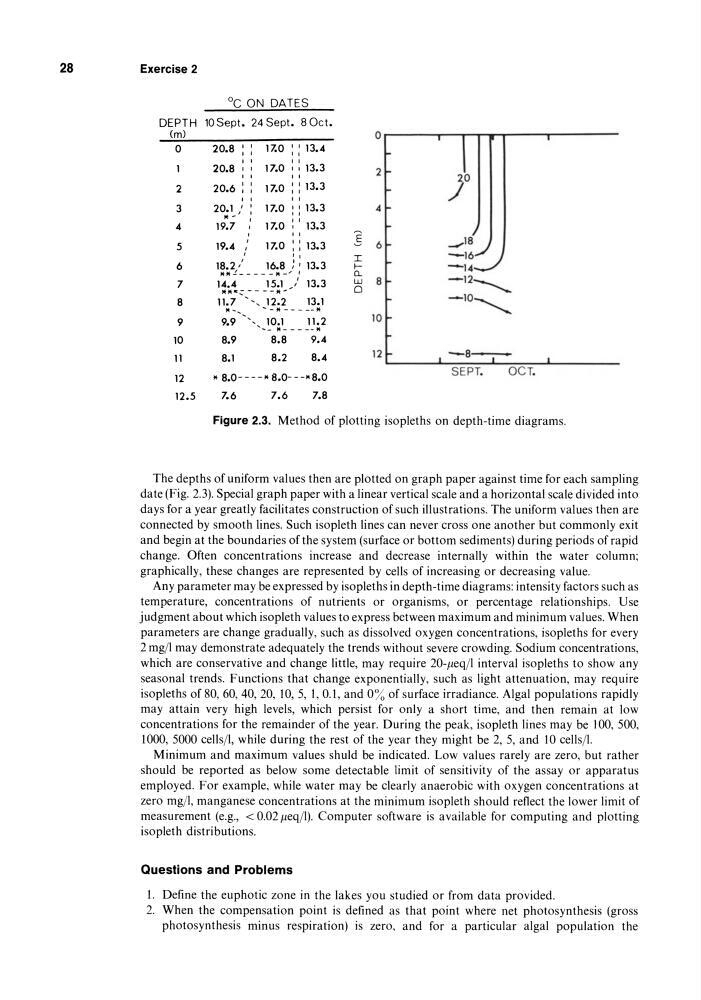
Figure 2.3. Method of plotting isopleths on depth-time diagrams.
The depths of uniform values then are plotted on graph paper against time for each sampling
date (Fig. 2.3). Special graph paper with a linear vertical scale and a horizontal scale divided into
days for a year greatly facilitates construction of such illustrations. The uniform values then are
connected by smooth lines. Such isopleth lines can never cross one another but commonly exit
and begin at the boundaries of the system (surface or bottom sediments) during periods of rapid
change. Often concentrations increase and decrease internally within the water column;
graphically, these changes are represented by cells of increasing or decreasing value.
Any parameter may be expressed by isopleths in depth-time diagrams: intensity factors such as
temperature, concentrations of nutrients or organisms, or percentage relationships. Use
judgment about which isopleth values to express between maximum and minimum values. When
parameters are change gradually, such as dissolved oxygen concentrations, isopleths for every
2 mg/I may demonstrate adequately the trends without severe crowding. Sodium concentrations,
which are conservative and change little, may require 20-j1eq/1 interval isopleths to show any
seasonal trends. Functions that change exponentially, such as light attenuation, may require
isopleths of 80, 60, 40, 20, 10, 5, 1, 0.1, and 0% of surface irradiance. Algal populations rapidly
may attain very high levels, which persist for only a short time, and then remain at low
concentrations for the remainder of the year. During the peak, isopleth lines may be 100, 500,
1000, 5000 cells/I, while during the rest of the year they might be 2, 5, and 10 cells/I.
Minimum and maximum values shuld be indicated. Low values rarely are zero, but rather
should be reported as below some detectable limit of sensitivity of the assay or apparatus
employed. For example, while water may be clearly anaerobic with oxygen concentrations at
zero mg/I, manganese concentrations at the minimum isopleth should reflect the lower limit of
measurement (e.g., < 0.02 j1eq/I). Computer software is available for computing and plotting
isopleth distributions.
Questions and Problems
1. Define the euphotic zone in the lakes you studied or from data provided.
2. When the compensation point is defined as that point where net photosynthesis (gross
photosynthesis minus respiration) is zero, and for a particular algal population the
Exercise 2
°c ON DATES
DEPTH 10 Sept. 24 Sept. 8 Oct.
(m)
0
,l
0
20.8
I I
17.0 : : 13.4
I I
I
I
I I
20.8 I I 17.0 I 113.3
2 ~
I I
I I
2
I I
17.0 : : 13.3
J
20.6 I I
I
3
20.1,
I
17.0 I I 13.3
4
,,' I
4
19.7 , 17.0 : I 13.3
II
,
, ,
]
19.4
, 17.0 : : 13.3
6
5
I
-
I
, ,
I
-16
6
18.2,'
16.8; I 13.3
r-14
**.!_--- -*-",'
CL
-12 ______
7
14.4
15.1 " 13.3
w
8
0
**c.: . . . . - - - -X"
13.1
-10-.........
8
11.7 ",12.2
" "
- * - -- -- *
9.9
, , ',,~0:.1 ____ 1_1;.2
10
9
10
8.9
8.8
9.4
11
8.1
8.2
8.4
12
- 8 - . -
12
" 8.0- - - - * 8.0- - -*8.0
SEPT.
OCT.
12.5
7.6
7.6
7.8
Figure 2.3. Method of plotting isopleths on depth-time diagrams.
The depths of uniform values then are plotted on graph paper against time for each sampling
date (Fig. 2.3). Special graph paper with a linear vertical scale and a horizontal scale divided into
days for a year greatly facilitates construction of such illustrations. The uniform values then are
connected by smooth lines. Such isopleth lines can never cross one another but commonly exit
and begin at the boundaries of the system (surface or bottom sediments) during periods of rapid
change. Often concentrations increase and decrease internally within the water column;
graphically, these changes are represented by cells of increasing or decreasing value.
Any parameter may be expressed by isopleths in depth-time diagrams: intensity factors such as
temperature, concentrations of nutrients or organisms, or percentage relationships. Use
judgment about which isopleth values to express between maximum and minimum values. When
parameters are change gradually, such as dissolved oxygen concentrations, isopleths for every
2 mg/I may demonstrate adequately the trends without severe crowding. Sodium concentrations,
which are conservative and change little, may require 20-j1eq/1 interval isopleths to show any
seasonal trends. Functions that change exponentially, such as light attenuation, may require
isopleths of 80, 60, 40, 20, 10, 5, 1, 0.1, and 0% of surface irradiance. Algal populations rapidly
may attain very high levels, which persist for only a short time, and then remain at low
concentrations for the remainder of the year. During the peak, isopleth lines may be 100, 500,
1000, 5000 cells/I, while during the rest of the year they might be 2, 5, and 10 cells/I.
Minimum and maximum values shuld be indicated. Low values rarely are zero, but rather
should be reported as below some detectable limit of sensitivity of the assay or apparatus
employed. For example, while water may be clearly anaerobic with oxygen concentrations at
zero mg/I, manganese concentrations at the minimum isopleth should reflect the lower limit of
measurement (e.g., < 0.02 j1eq/I). Computer software is available for computing and plotting
isopleth distributions.
Questions and Problems
1. Define the euphotic zone in the lakes you studied or from data provided.
2. When the compensation point is defined as that point where net photosynthesis (gross
photosynthesis minus respiration) is zero, and for a particular algal population the