

320
N
o
0':::
UJ !!
> .:
d'i> Vl E
Vl~
15
N
o
UJ
0
Z
«
J:~
() ~
u.-;$.
o E
UJ"'~~
er
N
0
Exercise 24
Table 24.1. Approximate diffusion constants (k) for gaseous
oxygen across the air-water interface in streams."
k(g/m 2 -h-atm)'
Remarks
Pools
Rimes
0.15 (0.05-0.3)
0.8 (0.5-1.5)
Higher if windy
Higher for waterfalls
aFrom c.A.S. Hall (personal communication).
bProrate according to area in pools and rimes.
Ck(g/m 3 ·h·atm)=k/mean depth in m.
12 r---r---~--~--'---'----r---r---r---'
A
SUNRISE
SUNSET
10
+
+
6
o F---~--+---+---~--~--~--_r--_+--~
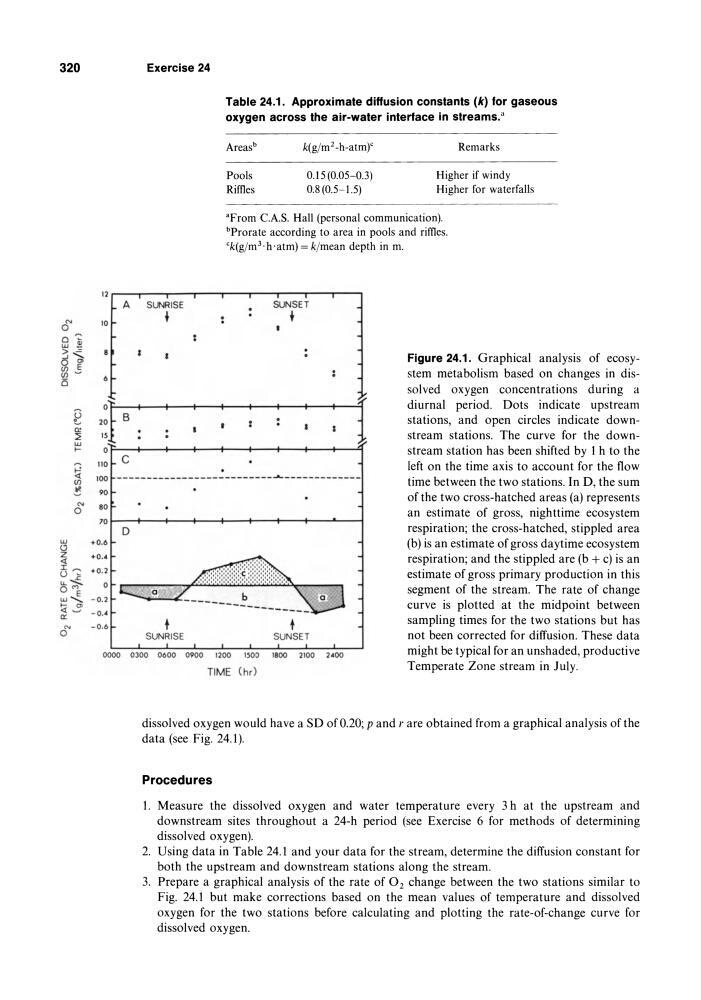
Figure 24.1. Graphical analysis of ecosystem metabolism based on changes in dissolved oxygen concentrations during a
diurnal period. Dots indicate upstream
stations, and open circles indicate downstream stations. The curve for the downstream station has been shifted by 1 h to the
left on the time axis to account for the flow
time between the two stations. In 0, the sum
of the two cross-hatched areas (a) represents
an estimate of gross, nighttime ecosystem
respiration; the cross-hatched, stippled area
(b) is an estimate of gross daytime ecosystem
respiration; and the stippled are (b + c) is an
estimate of gross primary production in this
segment of the stream. The rate of change
curve is plotted at the midpoint between
sampling times for the two stations but has
not been corrected for diffusion. These data
might be typical for an unshaded, productive
Temperate Zone stream in July.
no c
tOO ------ ----- -------- -------~------- -----90
80
70r---+---+---~--~--~--_r--_+--~--~
D
+0.6
+0.4
+0.2
0
- 0.2
- 0.'
-0.6
0000
t
t
SUNRISE
SUNSET
0300 0600 0900 1200
1500
1800 2100 2.00
TIME (hr)
dissolved oxygen would have a SO of 0.20; p and r are obtained from a graphical analysis of the
data (see Fig. 24.1).
Procedures
1. Measure the dissolved oxygen and water temperature every 3 h at the upstream and
downstream sites throughout a 24-h period (see Exercise 6 for methods of determining
dissolved oxygen).
2. Using data in Table 24.1 and your data for the stream, determine the diffusion constant for
both the upstream and downstream stations along the stream.
3. Prepare a graphical analysis of the rate of O 2 change between the two stations similar to
Fig. 24.1 but make corrections based on the mean values of temperature and dissolved
oxygen for the two stations before calculating and plotting the rate-of-change curve for
dissolved oxygen.
N
o
0':::
UJ !!
> .:
d'i> Vl E
Vl~
15
N
o
UJ
0
Z
«
J:~
() ~
u.-;$.
o E
UJ"'~~
er
N
0
Exercise 24
Table 24.1. Approximate diffusion constants (k) for gaseous
oxygen across the air-water interface in streams."
k(g/m 2 -h-atm)'
Remarks
Pools
Rimes
0.15 (0.05-0.3)
0.8 (0.5-1.5)
Higher if windy
Higher for waterfalls
aFrom c.A.S. Hall (personal communication).
bProrate according to area in pools and rimes.
Ck(g/m 3 ·h·atm)=k/mean depth in m.
12 r---r---~--~--'---'----r---r---r---'
A
SUNRISE
SUNSET
10
+
+
6
o F---~--+---+---~--~--~--_r--_+--~
Figure 24.1. Graphical analysis of ecosystem metabolism based on changes in dissolved oxygen concentrations during a
diurnal period. Dots indicate upstream
stations, and open circles indicate downstream stations. The curve for the downstream station has been shifted by 1 h to the
left on the time axis to account for the flow
time between the two stations. In 0, the sum
of the two cross-hatched areas (a) represents
an estimate of gross, nighttime ecosystem
respiration; the cross-hatched, stippled area
(b) is an estimate of gross daytime ecosystem
respiration; and the stippled are (b + c) is an
estimate of gross primary production in this
segment of the stream. The rate of change
curve is plotted at the midpoint between
sampling times for the two stations but has
not been corrected for diffusion. These data
might be typical for an unshaded, productive
Temperate Zone stream in July.
no c
tOO ------ ----- -------- -------~------- -----90
80
70r---+---+---~--~--~--_r--_+--~--~
D
+0.6
+0.4
+0.2
0
- 0.2
- 0.'
-0.6
0000
t
t
SUNRISE
SUNSET
0300 0600 0900 1200
1500
1800 2100 2.00
TIME (hr)
dissolved oxygen would have a SO of 0.20; p and r are obtained from a graphical analysis of the
data (see Fig. 24.1).
Procedures
1. Measure the dissolved oxygen and water temperature every 3 h at the upstream and
downstream sites throughout a 24-h period (see Exercise 6 for methods of determining
dissolved oxygen).
2. Using data in Table 24.1 and your data for the stream, determine the diffusion constant for
both the upstream and downstream stations along the stream.
3. Prepare a graphical analysis of the rate of O 2 change between the two stations similar to
Fig. 24.1 but make corrections based on the mean values of temperature and dissolved
oxygen for the two stations before calculating and plotting the rate-of-change curve for
dissolved oxygen.