

Diurnal Changes in a Stream Ecosystem
319
precombusted glass fiber filters (see Exercises 7 and 9), and then the change in weight after
combustion at 500°C for 2 h can be used to differentiate between the inorganic and organic
components. However, studies of particulate matter may not be compatible with the other
activities in this exercise, since great care must be taken so that the sediments are not disturbed
upstream of the sites where particulate matter is being collected.
2. Based on discharge and concentration measurements, calculate and plot the flux (in g/sec) of
PO/-, N0 3 -, alkalinity, H+, and dissolved organic carbon for each site throughout the
diurnal study. Determine the drainage area for each site from a topographic map and
calculate the input and output flux for each segment of the stream in terms of g/ha-sec or
g/ha-day.
3. To obtain some indication of upstream-downstream changes, plot the instantaneous nutrient
flux (g/sec) at the upstream site and superimpose on this graph the flux for the downstream
site, after adjusting its real time by the time of flow between the two sites. Compute with an
electronic digitizer, by planimetry, or by counting squares the change in chemical flux between
the two sites throughout the diurnal period. Plot this change in flux with time.
4. Compare the total flux (g/day) for each chemical at the upstream site with the daily flux for the
downstream site. Which site had the largest flux? Why?
Questions
1. What kinds of inputs or losses were not measured in this study? How could you measure
these? [See Fisher and Likens (1973) and Likens et al. (1977).J
2. How do you explain the differences in concentrations during the diurnal cycle? Between
upstream and downstream sites? [See Manny and Wetzel (1973).J
3. What would be the effects of a rainstorm on the results?
4. How might changing concentrations be sampled realistically or optimally in a long-term
study (a year or more)? [See Wetzel and Manny (1977) and Likens et al. (1977).J
5. Which was more important to total flux, discharge or concentration? Why?
6. Why do concentrations (mg/I) and fluxes (kg/day) of particulate organic matter fluctuate
much more than dissolved organic matter or many nutrients on a diurnal or annual basis?
What effects could growth patterns of aquatic and terrestrial vegetation or activity of animals
have? [See Manny and Wetzel (1973), Wetzel and Otsuki (1974), and Likens et al. (1977).J
OPTION 3. ECOSYSTEM METABOLISM
An estimation of ecosystem metabolism (production and respiration) can be made from changes
in concentration of dissolved oxygen or from changes in pH. We shall describe the two-station
method, which is based on changes in dissolved oxygen concentration over a diurnal period
(Odum, 1956; Owens, 1969). The procedures for both the O 2 and pH methods are described in
detail in Hall and Moll (1975). The dissolved oxygen method is based on the following
relationship:
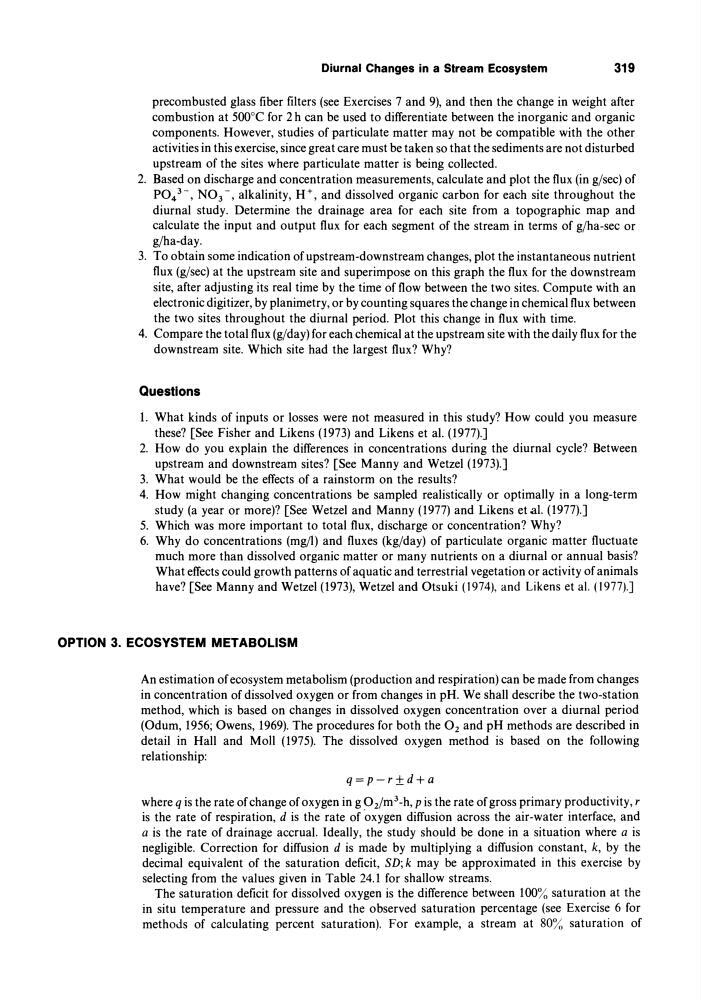
q=p-r±d+a
where q is the rate of change of oxygen in g 02/m3-h, p is the rate of gross primary productivity, r
is the rate of respiration, d is the rate of 'oxygen diffusion across the air-water interface, and
a is the rate of drainage accrual. Ideally, the study should be done in a situation where a is
negligible. Correction for diffusion d is made by multiplying a diffusion constant, k, by the
decimal equivalent of the saturation deficit, SD; k may be approximated in this exercise by
selecting from the values given in Table 24.1 for shallow streams.
The saturation deficit for dissolved oxygen is the difference between 100% saturation at the
in situ temperature and pressure and the observed saturation percentage (see Exercise 6 for
methods of calculating percent saturation). For example, a stream at 80% saturation of
319
precombusted glass fiber filters (see Exercises 7 and 9), and then the change in weight after
combustion at 500°C for 2 h can be used to differentiate between the inorganic and organic
components. However, studies of particulate matter may not be compatible with the other
activities in this exercise, since great care must be taken so that the sediments are not disturbed
upstream of the sites where particulate matter is being collected.
2. Based on discharge and concentration measurements, calculate and plot the flux (in g/sec) of
PO/-, N0 3 -, alkalinity, H+, and dissolved organic carbon for each site throughout the
diurnal study. Determine the drainage area for each site from a topographic map and
calculate the input and output flux for each segment of the stream in terms of g/ha-sec or
g/ha-day.
3. To obtain some indication of upstream-downstream changes, plot the instantaneous nutrient
flux (g/sec) at the upstream site and superimpose on this graph the flux for the downstream
site, after adjusting its real time by the time of flow between the two sites. Compute with an
electronic digitizer, by planimetry, or by counting squares the change in chemical flux between
the two sites throughout the diurnal period. Plot this change in flux with time.
4. Compare the total flux (g/day) for each chemical at the upstream site with the daily flux for the
downstream site. Which site had the largest flux? Why?
Questions
1. What kinds of inputs or losses were not measured in this study? How could you measure
these? [See Fisher and Likens (1973) and Likens et al. (1977).J
2. How do you explain the differences in concentrations during the diurnal cycle? Between
upstream and downstream sites? [See Manny and Wetzel (1973).J
3. What would be the effects of a rainstorm on the results?
4. How might changing concentrations be sampled realistically or optimally in a long-term
study (a year or more)? [See Wetzel and Manny (1977) and Likens et al. (1977).J
5. Which was more important to total flux, discharge or concentration? Why?
6. Why do concentrations (mg/I) and fluxes (kg/day) of particulate organic matter fluctuate
much more than dissolved organic matter or many nutrients on a diurnal or annual basis?
What effects could growth patterns of aquatic and terrestrial vegetation or activity of animals
have? [See Manny and Wetzel (1973), Wetzel and Otsuki (1974), and Likens et al. (1977).J
OPTION 3. ECOSYSTEM METABOLISM
An estimation of ecosystem metabolism (production and respiration) can be made from changes
in concentration of dissolved oxygen or from changes in pH. We shall describe the two-station
method, which is based on changes in dissolved oxygen concentration over a diurnal period
(Odum, 1956; Owens, 1969). The procedures for both the O 2 and pH methods are described in
detail in Hall and Moll (1975). The dissolved oxygen method is based on the following
relationship:
q=p-r±d+a
where q is the rate of change of oxygen in g 02/m3-h, p is the rate of gross primary productivity, r
is the rate of respiration, d is the rate of 'oxygen diffusion across the air-water interface, and
a is the rate of drainage accrual. Ideally, the study should be done in a situation where a is
negligible. Correction for diffusion d is made by multiplying a diffusion constant, k, by the
decimal equivalent of the saturation deficit, SD; k may be approximated in this exercise by
selecting from the values given in Table 24.1 for shallow streams.
The saturation deficit for dissolved oxygen is the difference between 100% saturation at the
in situ temperature and pressure and the observed saturation percentage (see Exercise 6 for
methods of calculating percent saturation). For example, a stream at 80% saturation of