

Bacterial Growth and Productivity
261
4. Radioassay:
a. As the vials are organized for counting, wipe each externally with 70% ethanol.
Use plastic gloves.
b. Radioassay with an appropriate LS spectrometer with a standard tritium
program (e.g., 20min or 2%).
c. Select six vials that have differing quench numbers for internal standardization
(samples with > 1500 cpm are preferred). Add an appropriate amount of a
standard (e.g., 3H-hexadecane or 3H 2 0) and radioassay (ca. lOmin or to high
statistical efficiency, 99%).
Bacterial Productivity Calculations
1. Convert counts per minute (cpm) to disintegration per minute (dpm):
dpm = cpm - backgroundcpm (100)
% efficiency of radioassay
The efficiency is determined from standards of known activity within the LS
spectrometer capabilities. Follow the instructions of the manufacturer.
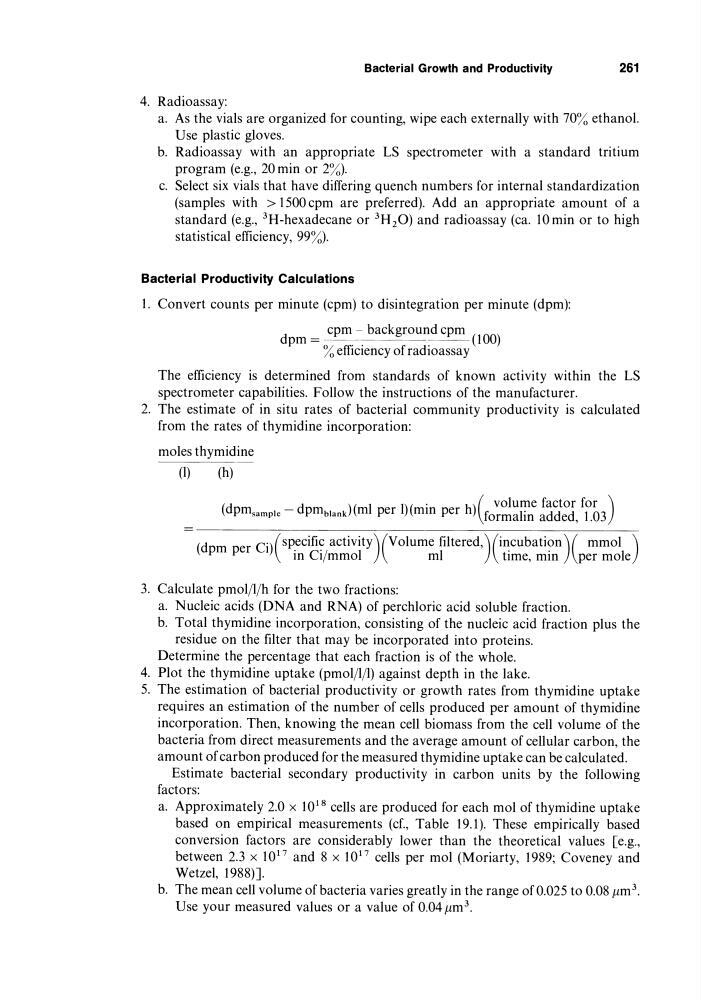
2. The estimate of in situ rates of bacterial community productivity is calculated
from the rates of thymidine incorporation:
moles thymidine
(I)
(h)
(d
d
)( I
I ·
h)( volume factor for )
pm sample - pmblank m per Hmm per
formalin added, 1.03
( dpm er Ci)(sp.ecifi? activitY)(Volume filtered,)(i~cubati?n)( mmol )
p
m CI/mmol
ml
hme, mm per mole
3. Calculate pmoljljh for the two fractions:
a. Nucleic acids (DNA and RNA) of perchloric acid soluble fraction.
b. Total thymidine incorporation, consisting of the nucleic acid fraction plus the
residue on the filter that may be incorporated into proteins.
Determine the percentage that each fraction is of the whole.
4. Plot the thymidine uptake (pmoljljl) against depth in the lake.
5. The estimation of bacterial productivity or growth rates from thymidine uptake
requires an estimation of the number of cells produced per amount of thymidine
incorporation. Then, knowing the mean cell biomass from the cell volume of the
bacteria from direct measurements and the average amount of cellular carbon, the
amount of carbon produced for the measured thymidine uptake can be calculated.
Estimate bacterial secondary productivity in carbon units by the following
factors:
a. Approximately 2.0 x 10 18 cells are produced for each mol of thymidine uptake
based on empirical measurements (cf., Table 19.1). These empirically based
conversion factors are considerably lower than the theoretical values [e.g.,
between 2.3 x 10 17 and 8 x 10 17 cells per mol (Moriarty, 1989; Coveney and
Wetzel, 1988)].
b. The mean cell volume of bacteria varies greatly in the range of 0.025 to 0.08 ,um 3 •
Use your measured values or a value of 0.04 ,um 3 .
261
4. Radioassay:
a. As the vials are organized for counting, wipe each externally with 70% ethanol.
Use plastic gloves.
b. Radioassay with an appropriate LS spectrometer with a standard tritium
program (e.g., 20min or 2%).
c. Select six vials that have differing quench numbers for internal standardization
(samples with > 1500 cpm are preferred). Add an appropriate amount of a
standard (e.g., 3H-hexadecane or 3H 2 0) and radioassay (ca. lOmin or to high
statistical efficiency, 99%).
Bacterial Productivity Calculations
1. Convert counts per minute (cpm) to disintegration per minute (dpm):
dpm = cpm - backgroundcpm (100)
% efficiency of radioassay
The efficiency is determined from standards of known activity within the LS
spectrometer capabilities. Follow the instructions of the manufacturer.
2. The estimate of in situ rates of bacterial community productivity is calculated
from the rates of thymidine incorporation:
moles thymidine
(I)
(h)
(d
d
)( I
I ·
h)( volume factor for )
pm sample - pmblank m per Hmm per
formalin added, 1.03
( dpm er Ci)(sp.ecifi? activitY)(Volume filtered,)(i~cubati?n)( mmol )
p
m CI/mmol
ml
hme, mm per mole
3. Calculate pmoljljh for the two fractions:
a. Nucleic acids (DNA and RNA) of perchloric acid soluble fraction.
b. Total thymidine incorporation, consisting of the nucleic acid fraction plus the
residue on the filter that may be incorporated into proteins.
Determine the percentage that each fraction is of the whole.
4. Plot the thymidine uptake (pmoljljl) against depth in the lake.
5. The estimation of bacterial productivity or growth rates from thymidine uptake
requires an estimation of the number of cells produced per amount of thymidine
incorporation. Then, knowing the mean cell biomass from the cell volume of the
bacteria from direct measurements and the average amount of cellular carbon, the
amount of carbon produced for the measured thymidine uptake can be calculated.
Estimate bacterial secondary productivity in carbon units by the following
factors:
a. Approximately 2.0 x 10 18 cells are produced for each mol of thymidine uptake
based on empirical measurements (cf., Table 19.1). These empirically based
conversion factors are considerably lower than the theoretical values [e.g.,
between 2.3 x 10 17 and 8 x 10 17 cells per mol (Moriarty, 1989; Coveney and
Wetzel, 1988)].
b. The mean cell volume of bacteria varies greatly in the range of 0.025 to 0.08 ,um 3 •
Use your measured values or a value of 0.04 ,um 3 .