

Zooplankton Production
237
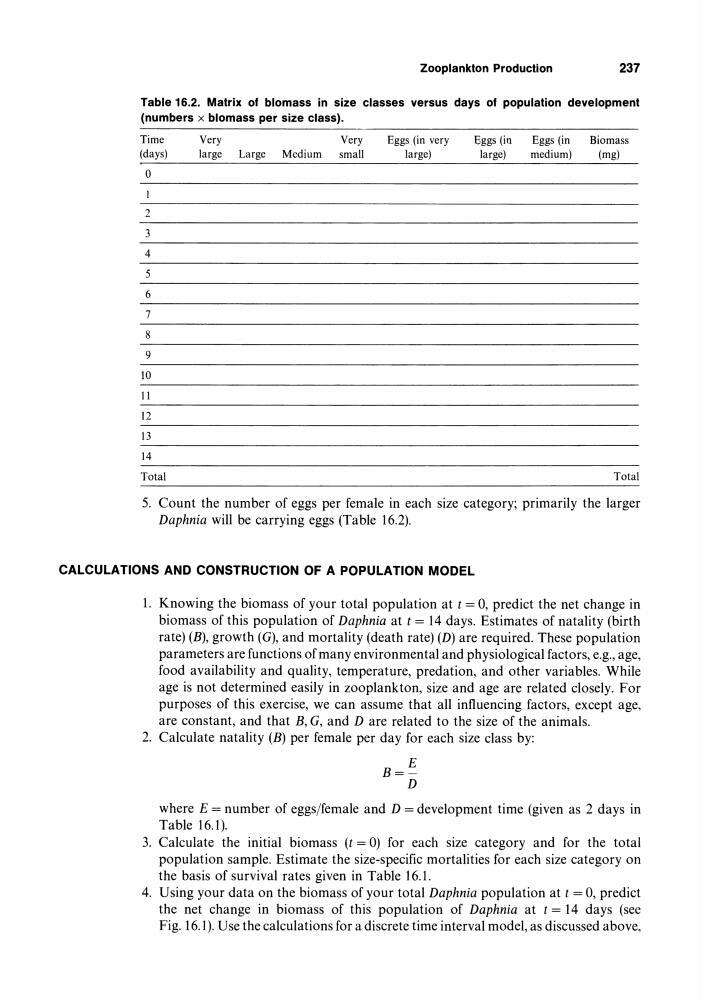
Table 16.2. Matrix of biomass in size classes versus days of population development
(numbers x biomass per size class).
Time
(days)
o
2
3
4
5
6
7
8
9
10
11
12
13
14
Total
Very
Very
large
Large
Medium
small
Eggs (in very
large)
Eggs (in
large)
Eggs (in
Biomass
medium)
(mg)
Total
5. Count the number of eggs per female in each size category; primarily the larger
Daphnia will be carrying eggs (Table 16.2).
CALCULATIONS AND CONSTRUCTION OF A POPULATION MODEL
1. Knowing the biomass of your total population at t = 0, predict the net change in
biomass of this population of Daphnia at t = 14 days. Estimates of natality (birth
rate) (E), growth (G), and mortality (death rate) (D) are required. These population
parameters are functions of many environmental and physiological factors, e.g., age,
food availability and quality, temperature, predation, and other variables. While
age is not determined easily in zooplankton, size and age are related closely. For
purposes of this exercise, we can assume that all influencing factors, except age,
are constant, and that E, G, and D are related to the size of the animals.
2. Calculate natality (E) per female per day for each size class by:
E
E=D
where E = number of eggs/female and D = development time (given as 2 days in
Table 16.1).
3. Calculate the initial biomass (t = 0) for each size category and for the total
population sample. Estimate the size-specific mortalities for each size category on
the basis of survival rates given in Table 16.1.
4. Using your data on the biomass of your total Daphnia population at t = 0, predict
the net change in biomass of this population of Daphnia at t = 14 days (see
Fig. 16.1). Use the calculations for a discrete time interval model, as discussed above,
237
Table 16.2. Matrix of biomass in size classes versus days of population development
(numbers x biomass per size class).
Time
(days)
o
2
3
4
5
6
7
8
9
10
11
12
13
14
Total
Very
Very
large
Large
Medium
small
Eggs (in very
large)
Eggs (in
large)
Eggs (in
Biomass
medium)
(mg)
Total
5. Count the number of eggs per female in each size category; primarily the larger
Daphnia will be carrying eggs (Table 16.2).
CALCULATIONS AND CONSTRUCTION OF A POPULATION MODEL
1. Knowing the biomass of your total population at t = 0, predict the net change in
biomass of this population of Daphnia at t = 14 days. Estimates of natality (birth
rate) (E), growth (G), and mortality (death rate) (D) are required. These population
parameters are functions of many environmental and physiological factors, e.g., age,
food availability and quality, temperature, predation, and other variables. While
age is not determined easily in zooplankton, size and age are related closely. For
purposes of this exercise, we can assume that all influencing factors, except age,
are constant, and that E, G, and D are related to the size of the animals.
2. Calculate natality (E) per female per day for each size class by:
E
E=D
where E = number of eggs/female and D = development time (given as 2 days in
Table 16.1).
3. Calculate the initial biomass (t = 0) for each size category and for the total
population sample. Estimate the size-specific mortalities for each size category on
the basis of survival rates given in Table 16.1.
4. Using your data on the biomass of your total Daphnia population at t = 0, predict
the net change in biomass of this population of Daphnia at t = 14 days (see
Fig. 16.1). Use the calculations for a discrete time interval model, as discussed above,