

Study of the Dynamics of Phosphorus
267
14" 16° 18° 20·
O·
8'
16·
24" 11"
17"
23'
29' tO e
i
, ,
'0
,
0
0,5 1,0 1.5
2,0 4,0
6.0 0 0,25 0.5 0.75 1.0 Pi
I
!
I
0 0.5 1.0 1.5 2.0 0 0.15
0.3
0
0
_~ _ _ __ 0..",j.450 0 0.25 0.5 0.75 1.0 At
III
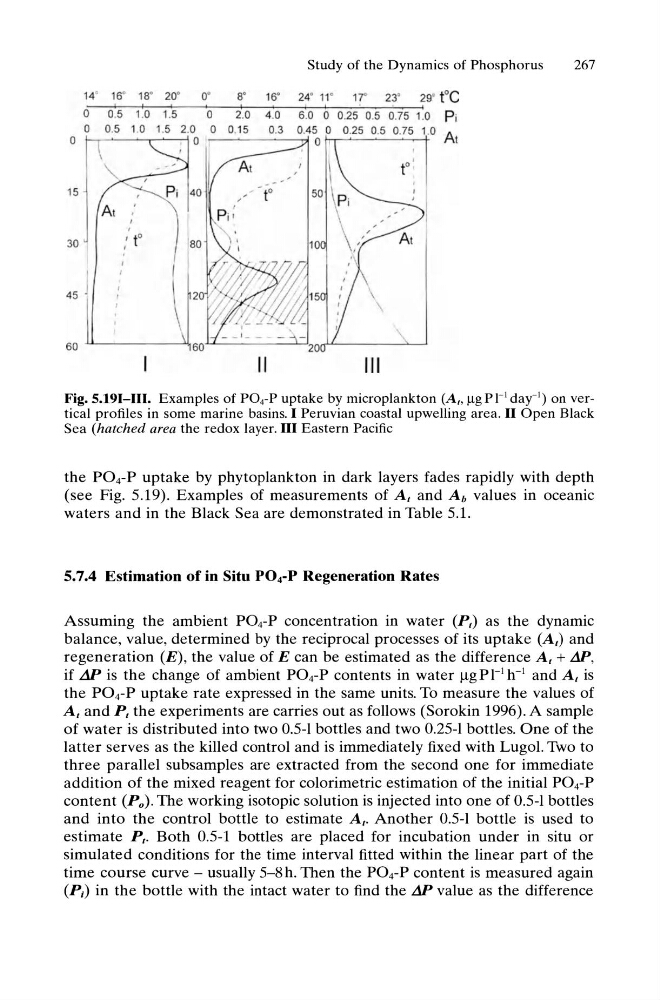
Fig. 5.191-111. Examples of P04-P uptake by microplankton (At, ~gPI-lday-l) on vertical profiles in some marine basins, I Peruvian coastal upwelling area, II Open Black
Sea (hatched area the redox layer. III Eastern Pacific
the P04-P uptake by phytoplankton in dark layers fades rapidly with depth
(see Fig. 5.19). Examples of measurements of At and Ab values in oceanic
waters and in the Black Sea are demonstrated in Table 5.1.
5.7.4 Estimation of in Situ P04-P Regeneration Rates
Assuming the ambient P04-P concentration in water (Pt) as the dynamic
balance, value, determined by the reciprocal processes of its uptake (At) and
regeneration (E), the value of E can be estimated as the difference At + AP,
if AP is the change of ambient P04-P contents in water IlgPl-1 h- 1 and At is
the P04-P uptake rate expressed in the same units. To measure the values of
At and P t the experiments are carries out as follows (Sorokin 1996). A sample
of water is distributed into two 0.5-1 bottles and two 0.25-1 bottles. One of the
latter serves as the killed control and is immediately fixed with Lugol. Two to
three parallel subsamples are extracted from the second one for immediate
addition of the mixed reagent for colorimetric estimation of the initial P04-P
content (Po). The working isotopic solution is injected into one of 0.5-1 bottles
and into the control bottle to estimate At. Another 0.5-1 bottle is used to
estimate Pt. Both 0.5-1 bottles are placed for incubation under in situ or
simulated conditions for the time interval fitted within the linear part of the
time course curve - usually 5-8h. Then the P04-P content is measured again
(Pi) in the bottle with the intact water to find the AP value as the difference
267
14" 16° 18° 20·
O·
8'
16·
24" 11"
17"
23'
29' tO e
i
, ,
'0
,
0
0,5 1,0 1.5
2,0 4,0
6.0 0 0,25 0.5 0.75 1.0 Pi
I
!
I
0 0.5 1.0 1.5 2.0 0 0.15
0.3
0
0
_~ _ _ __ 0..",j.450 0 0.25 0.5 0.75 1.0 At
III
Fig. 5.191-111. Examples of P04-P uptake by microplankton (At, ~gPI-lday-l) on vertical profiles in some marine basins, I Peruvian coastal upwelling area, II Open Black
Sea (hatched area the redox layer. III Eastern Pacific
the P04-P uptake by phytoplankton in dark layers fades rapidly with depth
(see Fig. 5.19). Examples of measurements of At and Ab values in oceanic
waters and in the Black Sea are demonstrated in Table 5.1.
5.7.4 Estimation of in Situ P04-P Regeneration Rates
Assuming the ambient P04-P concentration in water (Pt) as the dynamic
balance, value, determined by the reciprocal processes of its uptake (At) and
regeneration (E), the value of E can be estimated as the difference At + AP,
if AP is the change of ambient P04-P contents in water IlgPl-1 h- 1 and At is
the P04-P uptake rate expressed in the same units. To measure the values of
At and P t the experiments are carries out as follows (Sorokin 1996). A sample
of water is distributed into two 0.5-1 bottles and two 0.25-1 bottles. One of the
latter serves as the killed control and is immediately fixed with Lugol. Two to
three parallel subsamples are extracted from the second one for immediate
addition of the mixed reagent for colorimetric estimation of the initial P04-P
content (Po). The working isotopic solution is injected into one of 0.5-1 bottles
and into the control bottle to estimate At. Another 0.5-1 bottle is used to
estimate Pt. Both 0.5-1 bottles are placed for incubation under in situ or
simulated conditions for the time interval fitted within the linear part of the
time course curve - usually 5-8h. Then the P04-P content is measured again
(Pi) in the bottle with the intact water to find the AP value as the difference