

182
Use of Radioisotopic Methodology in Aquatic Microbial Ecology
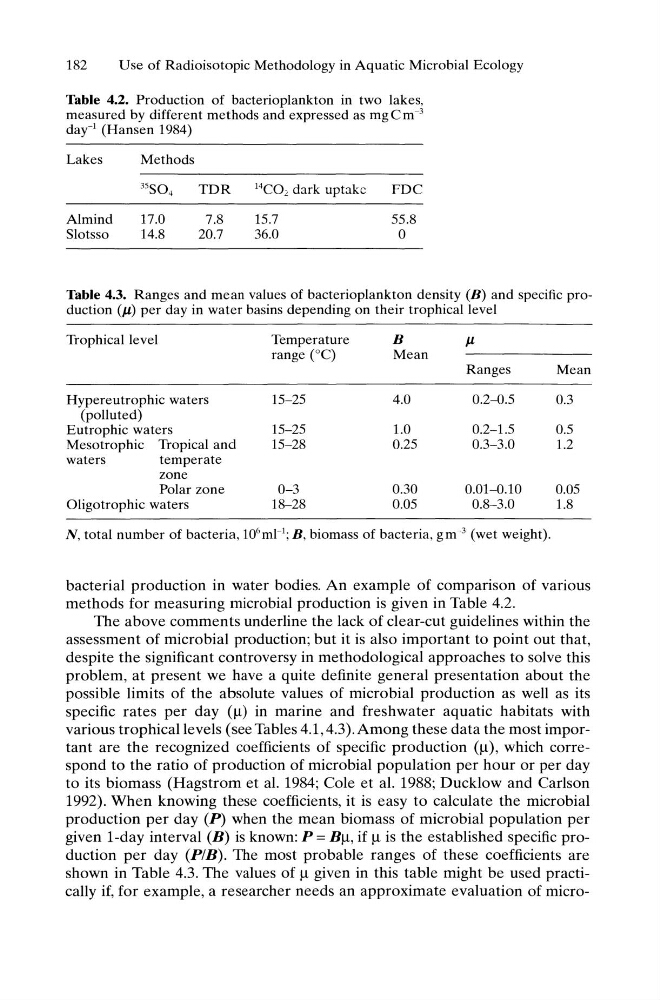
Table 4.2. Production of bacterioplankton in two lakes,
measured by different methods and expressed as mgCm- 3
day-l (Hansen 1984)
Lakes
Almind
Slotsso
Methods
17.0
14.8
TDR
14C02 dark uptakc
7.8
20.7
15.7
36.0
FDC
55.8
o
Table 4.3. Ranges and mean values of bacterioplankton density (B) and specific production (f.L) per day in water basins depending on their trophicallevel
Trophical level
Temperature
B
f.L
range (0C)
Mean
Ranges
Mean
Hypereutrophic waters
15-25
4.0
0.2-0.5
0.3
(polluted)
Eutrophic waters
15-25
1.0
0.2-1.5
0.5
Mesotrophic Tropical and
15-28
0.25
0.3-3.0
1.2
waters
temperate
zone
Polar zone
0-3
0.30
0.01-0.10
0.05
Oligotrophic waters
18-28
0.05
0.8-3.0
1.8
N, total number of bacteria, 10 6 ml-\ B, biomass of bacteria, gm- 3 (wet weight).
bacterial production in water bodies. An example of comparison of various
methods for measuring microbial production is given in Table 4.2.
The above comments underline the lack of clear-cut guidelines within the
assessment of microbial production; but it is also important to point out that,
despite the significant controversy in methodological approaches to solve this
problem, at present we have a quite definite general presentation about the
possible limits of the absolute values of microbial production as well as its
specific rates per day (/.1) in marine and freshwater aquatic habitats with
various trophicallevels (see Tables 4.1, 4.3). Among these data the most important are the recognized coefficients of specific production (/.1), which correspond to the ratio of production of microbial population per hour or per day
to its biomass (Hagstrom et al. 1984; Cole et al. 1988; Ducklow and Carlson
1992). When knowing these coefficients, it is easy to calculate the microbial
production per day (P) when the mean biomass of microbial population per
given I-day interval (B) is known: P = B/.1, if J.l is the established specific production per day (PIB). The most probable ranges of these coefficients are
shown in Table 4.3. The values of /.1 given in this table might be used practically if, for example, a researcher needs an approximate evaluation of micro-
Use of Radioisotopic Methodology in Aquatic Microbial Ecology
Table 4.2. Production of bacterioplankton in two lakes,
measured by different methods and expressed as mgCm- 3
day-l (Hansen 1984)
Lakes
Almind
Slotsso
Methods
17.0
14.8
TDR
14C02 dark uptakc
7.8
20.7
15.7
36.0
FDC
55.8
o
Table 4.3. Ranges and mean values of bacterioplankton density (B) and specific production (f.L) per day in water basins depending on their trophicallevel
Trophical level
Temperature
B
f.L
range (0C)
Mean
Ranges
Mean
Hypereutrophic waters
15-25
4.0
0.2-0.5
0.3
(polluted)
Eutrophic waters
15-25
1.0
0.2-1.5
0.5
Mesotrophic Tropical and
15-28
0.25
0.3-3.0
1.2
waters
temperate
zone
Polar zone
0-3
0.30
0.01-0.10
0.05
Oligotrophic waters
18-28
0.05
0.8-3.0
1.8
N, total number of bacteria, 10 6 ml-\ B, biomass of bacteria, gm- 3 (wet weight).
bacterial production in water bodies. An example of comparison of various
methods for measuring microbial production is given in Table 4.2.
The above comments underline the lack of clear-cut guidelines within the
assessment of microbial production; but it is also important to point out that,
despite the significant controversy in methodological approaches to solve this
problem, at present we have a quite definite general presentation about the
possible limits of the absolute values of microbial production as well as its
specific rates per day (/.1) in marine and freshwater aquatic habitats with
various trophicallevels (see Tables 4.1, 4.3). Among these data the most important are the recognized coefficients of specific production (/.1), which correspond to the ratio of production of microbial population per hour or per day
to its biomass (Hagstrom et al. 1984; Cole et al. 1988; Ducklow and Carlson
1992). When knowing these coefficients, it is easy to calculate the microbial
production per day (P) when the mean biomass of microbial population per
given I-day interval (B) is known: P = B/.1, if J.l is the established specific production per day (PIB). The most probable ranges of these coefficients are
shown in Table 4.3. The values of /.1 given in this table might be used practically if, for example, a researcher needs an approximate evaluation of micro-