

13 Water Quality
293
18
Wavelength (nm)
16
14
~ 12
"CD
u 10
c::
.e u
CD
I;::
8
& 6
4
2
200
400
600
Suspended Sediments (mg/l)
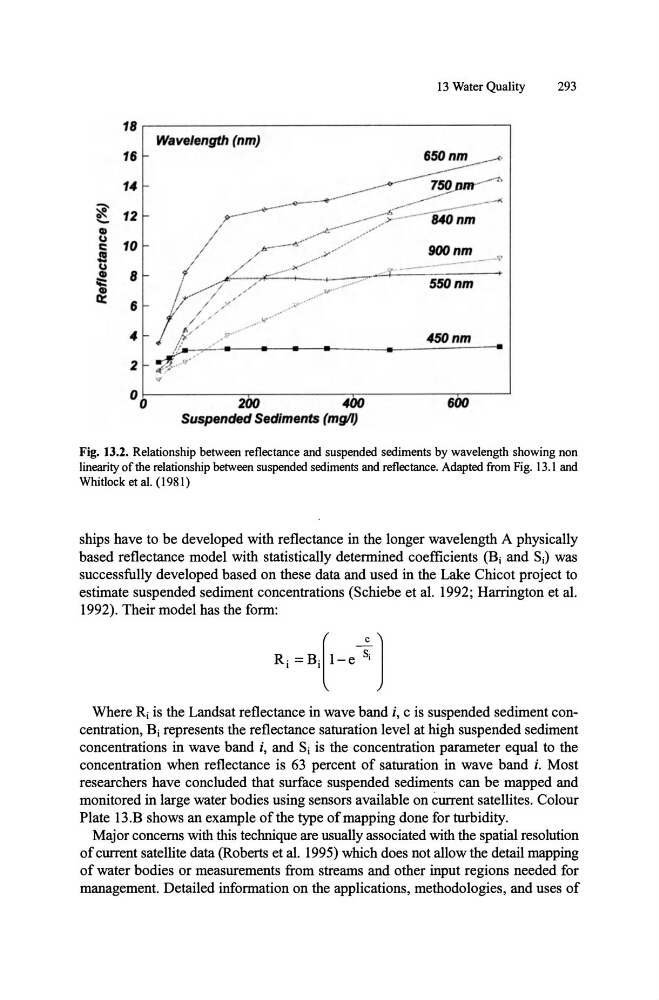
Fig. 13.2. Relationship between reflectance and suspended sediments by wavelength showing non
linearity of the relationship between suspended sediments and reflectance. Adapted from Fig. 13.1 and
Whitlock et al. (1981)
ships have to be developed with reflectance in the longer wavelength A physically
based reflectance model with statistically determined coefficients (Bi and Si) was
successfully developed based on these data and used in the Lake Chicot project to
estimate suspended sediment concentrations (Schiebe et al. 1992; Harrington et al.
1992). Their model has the form:
Where Ri is the Landsat reflectance in wave band i, c is suspended sediment concentration, Bi represents the reflectance saturation level at high suspended sediment
concentrations in wave band i, and Si is the concentration parameter equal to the
concentration when reflectance is 63 percent of saturation in wave band i. Most
researchers have concluded that surface suspended sediments can be mapped and
monitored in large water bodies using sensors available on current satellites. Colour
Plate 13.B shows an example of the type of mapping done for turbidity.
Major concerns with this technique are usually associated with the spatial resolution
of current satellite data (Roberts et al. 1995) which does not allow the detail mapping
of water bodies or measurements from streams and other input regions needed for
management. Detailed information on the applications, methodologies, and uses of
293
18
Wavelength (nm)
16
14
~ 12
"CD
u 10
c::
.e u
CD
I;::
8
& 6
4
2
200
400
600
Suspended Sediments (mg/l)
Fig. 13.2. Relationship between reflectance and suspended sediments by wavelength showing non
linearity of the relationship between suspended sediments and reflectance. Adapted from Fig. 13.1 and
Whitlock et al. (1981)
ships have to be developed with reflectance in the longer wavelength A physically
based reflectance model with statistically determined coefficients (Bi and Si) was
successfully developed based on these data and used in the Lake Chicot project to
estimate suspended sediment concentrations (Schiebe et al. 1992; Harrington et al.
1992). Their model has the form:
Where Ri is the Landsat reflectance in wave band i, c is suspended sediment concentration, Bi represents the reflectance saturation level at high suspended sediment
concentrations in wave band i, and Si is the concentration parameter equal to the
concentration when reflectance is 63 percent of saturation in wave band i. Most
researchers have concluded that surface suspended sediments can be mapped and
monitored in large water bodies using sensors available on current satellites. Colour
Plate 13.B shows an example of the type of mapping done for turbidity.
Major concerns with this technique are usually associated with the spatial resolution
of current satellite data (Roberts et al. 1995) which does not allow the detail mapping
of water bodies or measurements from streams and other input regions needed for
management. Detailed information on the applications, methodologies, and uses of