

266
Colour Plates of Chaps. 9-11
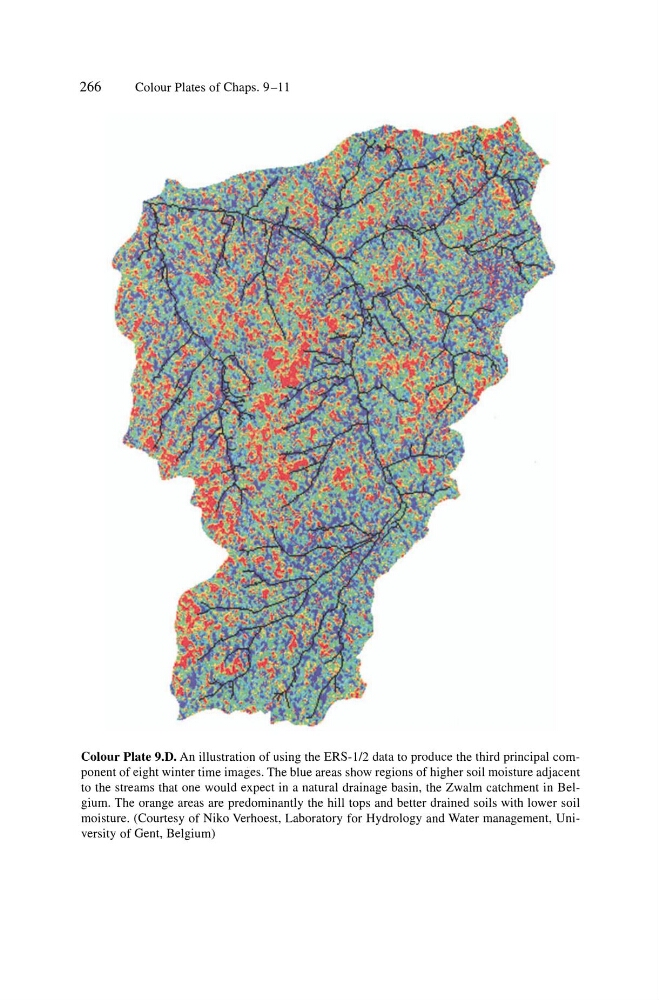
Colour Plate 9.D. An illustration of using the ERS-1I2 data to produce the third principal component of eight winter time images. The blue areas show regions of higher soil moisture adjacent
to the streams that one would expect in a natural drainage basin, the Zwalm catchment in Belgium. The orange areas are predominantly the hill tops and better drained soils with lower soil
moisture. (Courtesy of Niko Verhoest, Laboratory for Hydrology and Water management, University of Gent, Belgium)
Colour Plates of Chaps. 9-11
Colour Plate 9.D. An illustration of using the ERS-1I2 data to produce the third principal component of eight winter time images. The blue areas show regions of higher soil moisture adjacent
to the streams that one would expect in a natural drainage basin, the Zwalm catchment in Belgium. The orange areas are predominantly the hill tops and better drained soils with lower soil
moisture. (Courtesy of Niko Verhoest, Laboratory for Hydrology and Water management, University of Gent, Belgium)