

11 Snow and Ice
253
A
area of the basin or zone [km 2 ]
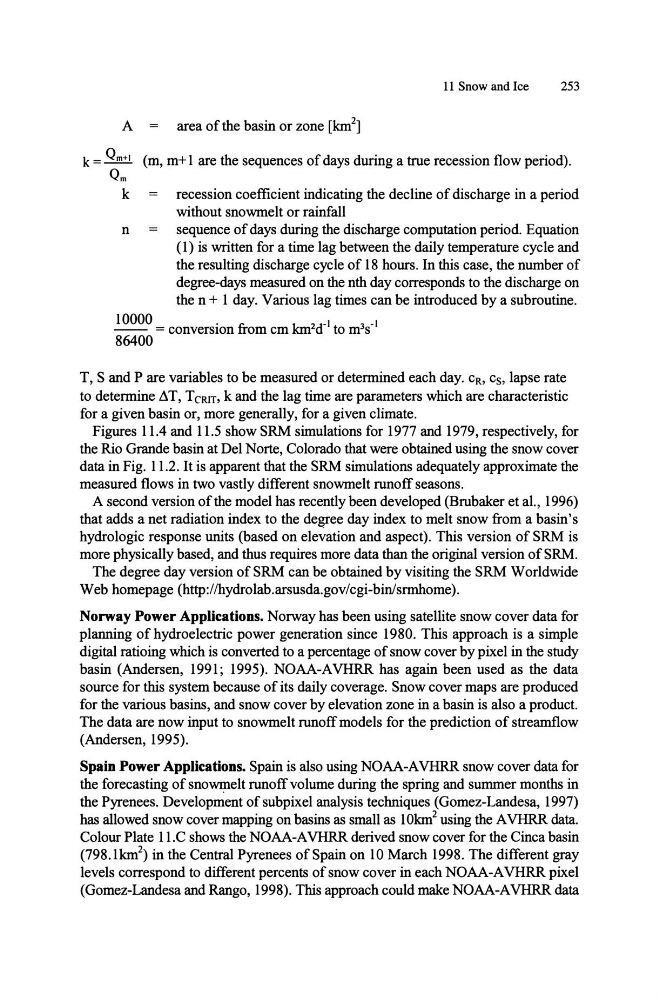
(m, m+ 1 are the sequences of days during a true recession flow period).
n
recession coefficient indicating the decline of discharge in a period
without snowmelt or rainfall
sequence of days during the discharge computation period. Equation
( 1) is written for a time lag between the daily temperature cycle and
the resulting discharge cycle of 18 hours. In this case, the number of
degree-days measured on the nth day corresponds to the discharge on
the n + I day. Various lag times can be introduced by a subroutine.
10000
. fr
km2d-1
3 -I
- - = converslOn om cm
to m s
86400
T, S and P are variables to be measured or detennined each day. CR, Cs, lapse rate
to determine LlT, TCR1T, k and the lag time are parameters which are characteristic
for a given basin or, more generally, for a given climate.
Figures 11.4 and 11.5 show SRM simulations for 1977 and 1979, respectively, for
the Rio Grande basin at Del Norte, Colorado that were obtained using the snow cover
data in Fig. 1l.2.1t is apparent that the SRM simulations adequately approximate the
measured flows in two vastly different snowmelt runoff seasons.
A second version of the model has recently been developed (Brubaker et at, 1996)
that adds a net radiation index to the degree day index to melt snow from a basin's
hydrologic response units (based on elevation and aspect). This version of SRM is
more physically based, and thus requires more data than the original version of SRM.
The degree day version of SRM can be obtained by visiting the SRM Worldwide
Web homepage (http://hydrolab.arsusda.gov/ cgi-binlsrrnhome).
Norway Power Applications. Norway has been using satellite snow cover data for
planning of hydroelectric power generation since 1980. This approach is a simple
digital ratioing which is converted to a percentage of snow cover by pixel in the study
basin (Andersen, 1991; 1995). NOAA-AVHRR has again been used as the data
source for this system because of its daily coverage. Snow cover maps are produced
for the various basins, and snow cover by elevation zone in a basin is also a product.
The data are now input to snowmelt runoff models for the prediction of streamflow
(Andersen, 1995).
Spain Power Applications. Spain is also using NOAA-A VHRR snow cover data for
the forecasting of snowmelt runoff volume during the spring and summer months in
the Pyrenees. Development of sub pixel analysis techniques (Gomez-Landesa, 1997)
has allowed snow cover mapping on basins as small as IOkm 2 using the A VHRR data.
Colour Plate II.C shows the NOAA-A VHRR derived snow cover for the Cinca basin
(798.lkm 2 ) in the Central Pyrenees of Spain on 10 March 1998. The different gray
levels correspond to different percents of snow cover in each NOAA-A VHRR pixel
(Gomez-Landesa and Rango, 1998). This approach could make NOAA-A VHRR data
253
A
area of the basin or zone [km 2 ]
(m, m+ 1 are the sequences of days during a true recession flow period).
n
recession coefficient indicating the decline of discharge in a period
without snowmelt or rainfall
sequence of days during the discharge computation period. Equation
( 1) is written for a time lag between the daily temperature cycle and
the resulting discharge cycle of 18 hours. In this case, the number of
degree-days measured on the nth day corresponds to the discharge on
the n + I day. Various lag times can be introduced by a subroutine.
10000
. fr
km2d-1
3 -I
- - = converslOn om cm
to m s
86400
T, S and P are variables to be measured or detennined each day. CR, Cs, lapse rate
to determine LlT, TCR1T, k and the lag time are parameters which are characteristic
for a given basin or, more generally, for a given climate.
Figures 11.4 and 11.5 show SRM simulations for 1977 and 1979, respectively, for
the Rio Grande basin at Del Norte, Colorado that were obtained using the snow cover
data in Fig. 1l.2.1t is apparent that the SRM simulations adequately approximate the
measured flows in two vastly different snowmelt runoff seasons.
A second version of the model has recently been developed (Brubaker et at, 1996)
that adds a net radiation index to the degree day index to melt snow from a basin's
hydrologic response units (based on elevation and aspect). This version of SRM is
more physically based, and thus requires more data than the original version of SRM.
The degree day version of SRM can be obtained by visiting the SRM Worldwide
Web homepage (http://hydrolab.arsusda.gov/ cgi-binlsrrnhome).
Norway Power Applications. Norway has been using satellite snow cover data for
planning of hydroelectric power generation since 1980. This approach is a simple
digital ratioing which is converted to a percentage of snow cover by pixel in the study
basin (Andersen, 1991; 1995). NOAA-AVHRR has again been used as the data
source for this system because of its daily coverage. Snow cover maps are produced
for the various basins, and snow cover by elevation zone in a basin is also a product.
The data are now input to snowmelt runoff models for the prediction of streamflow
(Andersen, 1995).
Spain Power Applications. Spain is also using NOAA-A VHRR snow cover data for
the forecasting of snowmelt runoff volume during the spring and summer months in
the Pyrenees. Development of sub pixel analysis techniques (Gomez-Landesa, 1997)
has allowed snow cover mapping on basins as small as IOkm 2 using the A VHRR data.
Colour Plate II.C shows the NOAA-A VHRR derived snow cover for the Cinca basin
(798.lkm 2 ) in the Central Pyrenees of Spain on 10 March 1998. The different gray
levels correspond to different percents of snow cover in each NOAA-A VHRR pixel
(Gomez-Landesa and Rango, 1998). This approach could make NOAA-A VHRR data