

10 Remote Sensing of Surface Water
231
L-band
13.5 em
'"rl
E
... G
~
.0
c:
..c:
Energy
2
~
00
::l
c:
. scattered with
0
""
'<
~
enhanced
r-..
>
4
Cl
'" C -band
return
::I:
~
~
5.45 em
8
X-band
and absorbed
12.5
3 ern
Grasses
Herbaceous
Timber
Type of vegetation over a water surface
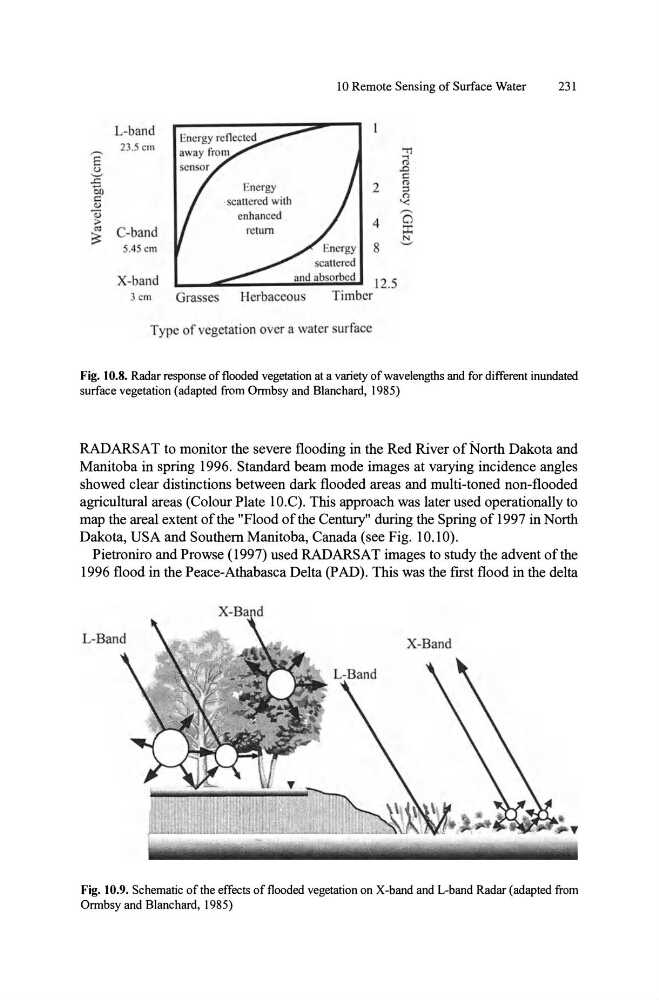
Fig. 10.8. Radar respottse of flooded vegetation at a variety of wavelengths and for different inundated
surface vegetation (adapted from Ormbsy and Blanchard, 1985)
RADARS AT to monitor the severe flooding in the Red River of North Dakota an.d
Manitoba in spring 1996. Standard beam mode images at varying incidence angles
showed clear distinctions between dark flooded areas and multi-toned non-flooded
agricultural areas (Colour Plate lO.C). This approach was later used operationally to
map the areal extent of the "Flood of the Century" during the Spring of 1997 in North
Dakota, USA and Southern Manitoba, Canada (see Fig. 10.10).
Pietroniro and Prowse (1997) used RADARSAT images to study the advent of the
1996 flood in the Peace-Athabasca Delta (PAD). This was the first flood in the delta
Fig. 10.9. Schematic of the effects of flooded vegetation on X-band and L-band Radar (adapted from
Ormbsy and Blanchard, 1985)
231
L-band
13.5 em
'"rl
E
... G
~
.0
c:
..c:
Energy
2
~
00
::l
c:
. scattered with
0
""
'<
~
enhanced
r-..
>
4
Cl
'" C -band
return
::I:
~
~
5.45 em
8
X-band
and absorbed
12.5
3 ern
Grasses
Herbaceous
Timber
Type of vegetation over a water surface
Fig. 10.8. Radar respottse of flooded vegetation at a variety of wavelengths and for different inundated
surface vegetation (adapted from Ormbsy and Blanchard, 1985)
RADARS AT to monitor the severe flooding in the Red River of North Dakota an.d
Manitoba in spring 1996. Standard beam mode images at varying incidence angles
showed clear distinctions between dark flooded areas and multi-toned non-flooded
agricultural areas (Colour Plate lO.C). This approach was later used operationally to
map the areal extent of the "Flood of the Century" during the Spring of 1997 in North
Dakota, USA and Southern Manitoba, Canada (see Fig. 10.10).
Pietroniro and Prowse (1997) used RADARSAT images to study the advent of the
1996 flood in the Peace-Athabasca Delta (PAD). This was the first flood in the delta
Fig. 10.9. Schematic of the effects of flooded vegetation on X-band and L-band Radar (adapted from
Ormbsy and Blanchard, 1985)