

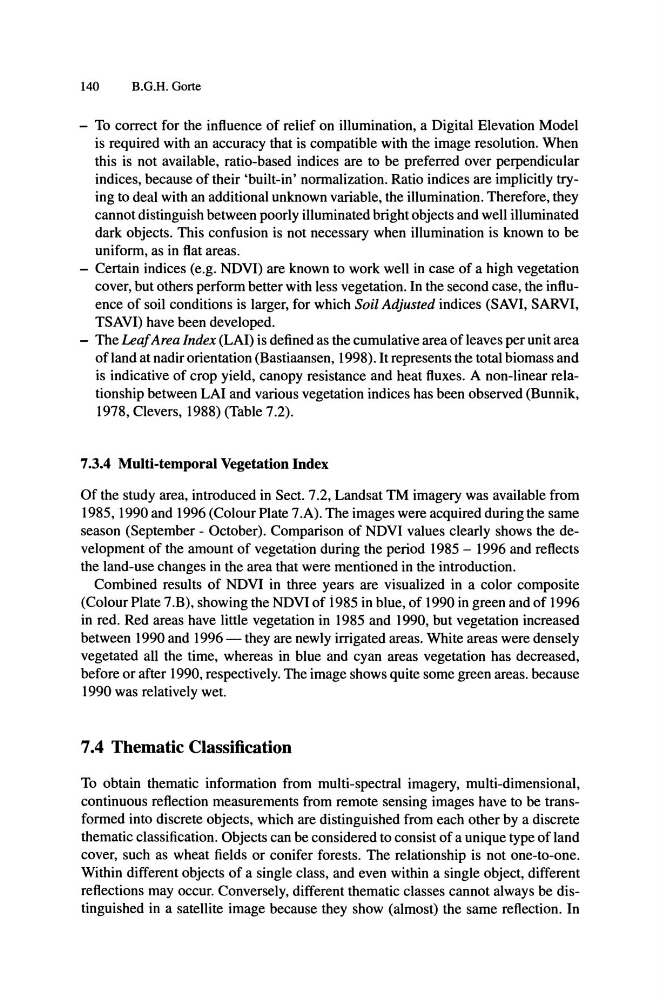
140
B.G.H. Gorte
- To correct for the influence of relief on illumination, a Digital Elevation Model
is required with an accuracy that is compatible with the image resolution. When
this is not available, ratio-based indices are to be preferred over perpendicular
indices, because of their 'built-in' normalization. Ratio indices are implicitly trying to deal with an additional unknown variable, the illumination. Therefore, they
cannot distinguish between poorly illuminated bright objects and well illuminated
dark objects. This confusion is not necessary when illumination is known to be
uniform, as in flat areas.
- Certain indices (e.g. NDVI) are known to work well in case of a high vegetation
cover, but others perform better with less vegetation. In the second case, the influence of soil conditions is larger, for which Soil Adjusted indices (SAVI, SARVI,
TSAVI) have been developed.
- The Leaf Area Index (LAI) is defined as the cumulative area of leaves per unit area
of land at nadir orientation (Bastiaansen, 1998). It represents the total biomass and
is indicative of crop yield, canopy resistance and heat fluxes. A non-linear relationship between LAI and various vegetation indices has been observed (Bunnik,
1978, Clevers, 1988) (Table 7.2).
7.3.4 Multi-temporal Vegetation Index
Of the study area, introduced in Sect. 7.2, Landsat TM imagery was available from
1985, 1990 and 1996 (Colour Plate 7.A). The images were acquired during the same
season (September - October). Comparison of NDVI values clearly shows the development of the amount of vegetation during the period 1985 - 1996 and reflects
the land-use changes in the area that were mentioned in the introduction.
Combined results of NDVI in three years are visualized in a color composite
(Colour Plate 7.B), showing the NDVI of 1985 in blue, of 1990 in green and of 1996
in red. Red areas have little vegetation in 1985 and 1990, but vegetation increased
between 1990 and 1996 - they are newly irrigated areas. White areas were densely
vegetated all the time, whereas in blue and cyan areas vegetation has decreased,
before or after 1990, respectively. The image shows quite some green areas. because
1990 was relatively wet.
7.4 Thematic Classification
To obtain thematic information from multi-spectral imagery, multi-dimensional,
continuous reflection measurements from remote sensing images have to be transformed into discrete objects, which are distinguished from each other by a discrete
thematic classification. Objects can be considered to consist of a unique type of land
cover, such as wheat fields or conifer forests. The relationship is not one-to-one.
Within different objects of a single class, and even within a single object, different
reflections may occur. Conversely, different thematic classes cannot always be distinguished in a satellite image because they show (almost) the same reflection. In
B.G.H. Gorte
- To correct for the influence of relief on illumination, a Digital Elevation Model
is required with an accuracy that is compatible with the image resolution. When
this is not available, ratio-based indices are to be preferred over perpendicular
indices, because of their 'built-in' normalization. Ratio indices are implicitly trying to deal with an additional unknown variable, the illumination. Therefore, they
cannot distinguish between poorly illuminated bright objects and well illuminated
dark objects. This confusion is not necessary when illumination is known to be
uniform, as in flat areas.
- Certain indices (e.g. NDVI) are known to work well in case of a high vegetation
cover, but others perform better with less vegetation. In the second case, the influence of soil conditions is larger, for which Soil Adjusted indices (SAVI, SARVI,
TSAVI) have been developed.
- The Leaf Area Index (LAI) is defined as the cumulative area of leaves per unit area
of land at nadir orientation (Bastiaansen, 1998). It represents the total biomass and
is indicative of crop yield, canopy resistance and heat fluxes. A non-linear relationship between LAI and various vegetation indices has been observed (Bunnik,
1978, Clevers, 1988) (Table 7.2).
7.3.4 Multi-temporal Vegetation Index
Of the study area, introduced in Sect. 7.2, Landsat TM imagery was available from
1985, 1990 and 1996 (Colour Plate 7.A). The images were acquired during the same
season (September - October). Comparison of NDVI values clearly shows the development of the amount of vegetation during the period 1985 - 1996 and reflects
the land-use changes in the area that were mentioned in the introduction.
Combined results of NDVI in three years are visualized in a color composite
(Colour Plate 7.B), showing the NDVI of 1985 in blue, of 1990 in green and of 1996
in red. Red areas have little vegetation in 1985 and 1990, but vegetation increased
between 1990 and 1996 - they are newly irrigated areas. White areas were densely
vegetated all the time, whereas in blue and cyan areas vegetation has decreased,
before or after 1990, respectively. The image shows quite some green areas. because
1990 was relatively wet.
7.4 Thematic Classification
To obtain thematic information from multi-spectral imagery, multi-dimensional,
continuous reflection measurements from remote sensing images have to be transformed into discrete objects, which are distinguished from each other by a discrete
thematic classification. Objects can be considered to consist of a unique type of land
cover, such as wheat fields or conifer forests. The relationship is not one-to-one.
Within different objects of a single class, and even within a single object, different
reflections may occur. Conversely, different thematic classes cannot always be distinguished in a satellite image because they show (almost) the same reflection. In