

Chapter 7: APPLICATIONS
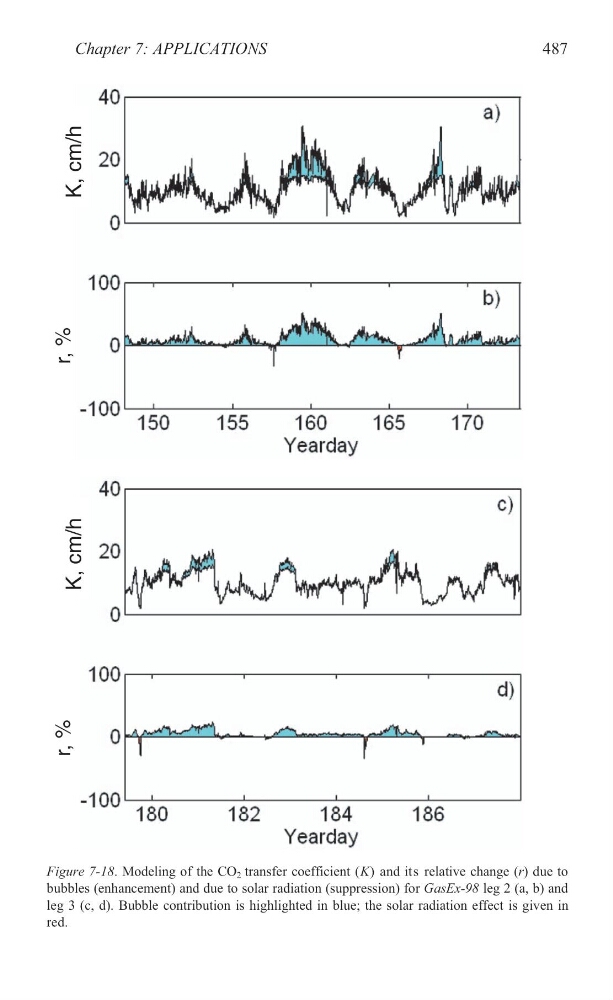
Figure 7-18. Modeling of the CO 2 transfer coefficient (K) and its relative change (r) due to
bubbles (enhancement) and due to solar radiation (suppression) for GasEx-98 leg 2 (a, b) and
leg 3 (c, d). Bubble contribution is highlighted in blue; the solar radiation effect is given in
red.
487
K, cm/h
r, %
K, cm/h
r, %
Figure 7-18. Modeling of the CO 2 transfer coefficient (K) and its relative change (r) due to
bubbles (enhancement) and due to solar radiation (suppression) for GasEx-98 leg 2 (a, b) and
leg 3 (c, d). Bubble contribution is highlighted in blue; the solar radiation effect is given in
red.
487
K, cm/h
r, %
K, cm/h
r, %