

THE NEAR-SURFACE LAYER OF THE OCEAN
where c
W is the whitecap coverage, and b is an empirical constant. The
empirical constants entering (7.27) have been determined only for clean
bubbles.
The Merlivat et al. (1993) parameterization is defined with empirical
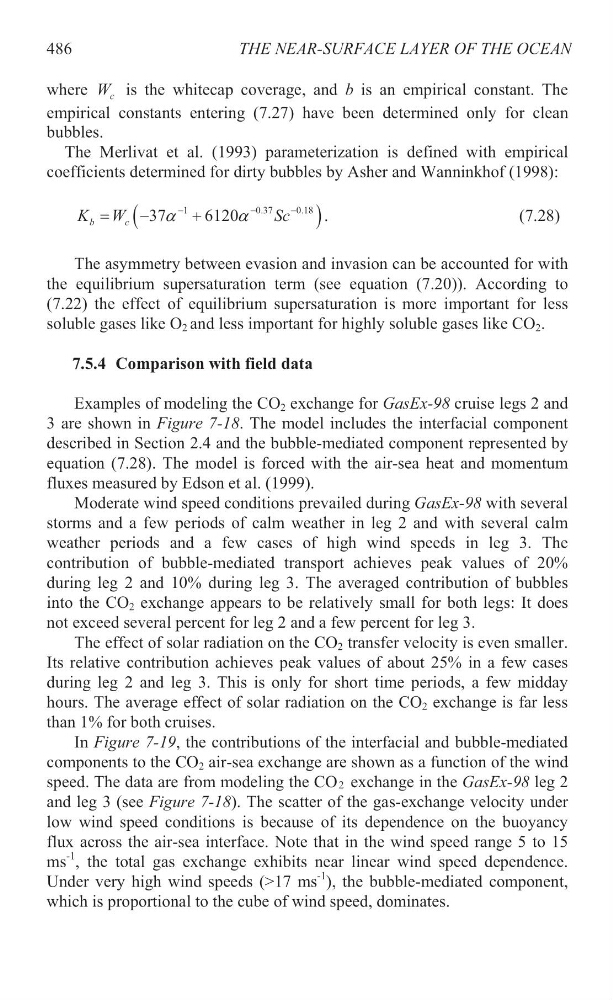
coefficients determined for dirty bubbles by Asher and Wanninkhof (1998):
1
0.37
0.18
37
6120
b
c
K W
Sc
D
D
.
(7.28)
The asymmetry between evasion and invasion can be accounted for with
the equilibrium supersaturation term (see equation (7.20)). According to
(7.22) the effect of equilibrium supersaturation is more important for less
soluble gases like O 2 and less important for highly soluble gases like CO 2 .
7.5.4 Comparison with field data
Examples of modeling the CO 2 exchange for GasEx-98 cruise legs 2 and
3 are shown in Figure 7-18. The model includes the interfacial component
described in Section 2.4 and the bubble-mediated component represented by
equation (7.28). The model is forced with the air-sea heat and momentum
fluxes measured by Edson et al. (1999).
Moderate wind speed conditions prevailed during GasEx-98 with several
storms and a few periods of calm weather in leg 2 and with several calm
weather periods and a few cases of high wind speeds in leg 3. The
contribution of bubble-mediated transport achieves peak values of 20%
during leg 2 and 10% during leg 3. The averaged contribution of bubbles
into the CO 2 exchange appears to be relatively small for both legs: It does
not exceed several percent for leg 2 and a few percent for leg 3.
The effect of solar radiation on the CO 2 transfer velocity is even smaller.
Its relative contribution achieves peak values of about 25% in a few cases
during leg 2 and leg 3. This is only for short time periods, a few midday
hours. The average effect of solar radiation on the CO 2 exchange is far less
than 1% for both cruises.
In Figure 7-19, the contributions of the interfacial and bubble-mediated
components to the CO 2 air-sea exchange are shown as a function of the wind
speed. The data are from modeling the CO2 exchange in the GasEx-98 leg 2
and leg 3 (see Figure 7-18). The scatter of the gas-exchange velocity under
low wind speed conditions is because of its dependence on the buoyancy
flux across the air-sea interface. Note that in the wind speed range 5 to 15
ms
-1 , the total gas exchange exhibits near linear wind speed dependence.
Under very high wind speeds (>17 ms
-1 ), the bubble-mediated component,
which is proportional to the cube of wind speed, dominates.
486
where c
W is the whitecap coverage, and b is an empirical constant. The
empirical constants entering (7.27) have been determined only for clean
bubbles.
The Merlivat et al. (1993) parameterization is defined with empirical
coefficients determined for dirty bubbles by Asher and Wanninkhof (1998):
1
0.37
0.18
37
6120
b
c
K W
Sc
D
D
.
(7.28)
The asymmetry between evasion and invasion can be accounted for with
the equilibrium supersaturation term (see equation (7.20)). According to
(7.22) the effect of equilibrium supersaturation is more important for less
soluble gases like O 2 and less important for highly soluble gases like CO 2 .
7.5.4 Comparison with field data
Examples of modeling the CO 2 exchange for GasEx-98 cruise legs 2 and
3 are shown in Figure 7-18. The model includes the interfacial component
described in Section 2.4 and the bubble-mediated component represented by
equation (7.28). The model is forced with the air-sea heat and momentum
fluxes measured by Edson et al. (1999).
Moderate wind speed conditions prevailed during GasEx-98 with several
storms and a few periods of calm weather in leg 2 and with several calm
weather periods and a few cases of high wind speeds in leg 3. The
contribution of bubble-mediated transport achieves peak values of 20%
during leg 2 and 10% during leg 3. The averaged contribution of bubbles
into the CO 2 exchange appears to be relatively small for both legs: It does
not exceed several percent for leg 2 and a few percent for leg 3.
The effect of solar radiation on the CO 2 transfer velocity is even smaller.
Its relative contribution achieves peak values of about 25% in a few cases
during leg 2 and leg 3. This is only for short time periods, a few midday
hours. The average effect of solar radiation on the CO 2 exchange is far less
than 1% for both cruises.
In Figure 7-19, the contributions of the interfacial and bubble-mediated
components to the CO 2 air-sea exchange are shown as a function of the wind
speed. The data are from modeling the CO2 exchange in the GasEx-98 leg 2
and leg 3 (see Figure 7-18). The scatter of the gas-exchange velocity under
low wind speed conditions is because of its dependence on the buoyancy
flux across the air-sea interface. Note that in the wind speed range 5 to 15
ms
-1 , the total gas exchange exhibits near linear wind speed dependence.
Under very high wind speeds (>17 ms
-1 ), the bubble-mediated component,
which is proportional to the cube of wind speed, dominates.
486